AWS Lambda usage is exploding, and at last week’s re:invent conference, it was one of the key priorities for AWS. Lambda simplifies infrastructure by removing host management, and giving you the advantage of paying for just the compute and storage you use. This means it’s important to monitor your usage carefully to ensure you are managing your spend well.
This post outlines the various options and approaches to AWS Lambda monitoring so you can make an informed decision about how you monitor your Lambda applications.
AWS Lambda Monitoring Basics
AWS provides vital stats for Lambda in a couple of ways. You can view metrics from your Lambda console, the CloudWatch console, via the Lambda or CloudWatch command line, or even through the CloudWatch API.
The Lambda console gives you an overview of just the vital stats of your Lambda app.
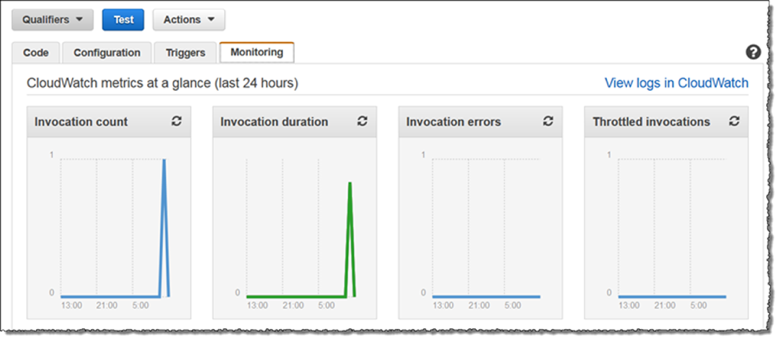
For a more detailed view, you can click through to the CloudWatch console. Here are the key terms you’ll notice in your CloudWatch console:
- Invocations: Invocations are the number of times a Lambda function is triggered in response to an event or API call.
- Errors: The number of failed invocations.
- Duration times: The time it takes to execute a Lambda function. This is measured in milliseconds.
- Throttles: The number of invocation attempts that were not executed because they exceed concurrency limits.
- Dead letter errors: Asynchronous errors are sent to a dead letter queue for further troubleshooting. If these errors are not written to a DLQ, they are counted as dead letter errors.
Within CloudWatch you can set alarms to notify you of issues, or identify unused resources. You can also view all logs generated by your code in CloudWatch Logs. Archiving these logs will incur additional cost, but you can decide how far back you’d like to store log data.
Troubleshooting Common Errors in Lambda
With AWS lambda, you don’t have underlying infrastructure to monitor. This means that most of the errors can be resolved by troubleshooting your code. Here are the common errors that occur with Lambda:
- IAM roles & permissions: For your code to access other AWS services, you need to configure IAM roles correctly. If not done, this could result in a permissions denied error.
- Timeout exceeded: Some functions can take longer to execute than others, and will need a longer timeout setting.
- Memory exceeded: Some jobs like database operations require less memory. However, jobs that involve large files, like images, for example, will need more memory. You will need to adjust the MemorySize setting in your code if you see this error.
Advanced Lambda Monitoring
As you start out using Lambda for part of your app, you can get by with AWS’ default monitoring options. Once you start expanding Lambda usage in your applications, and even run entire apps in Lambda, you’ll need the power of a more robust monitoring tool.
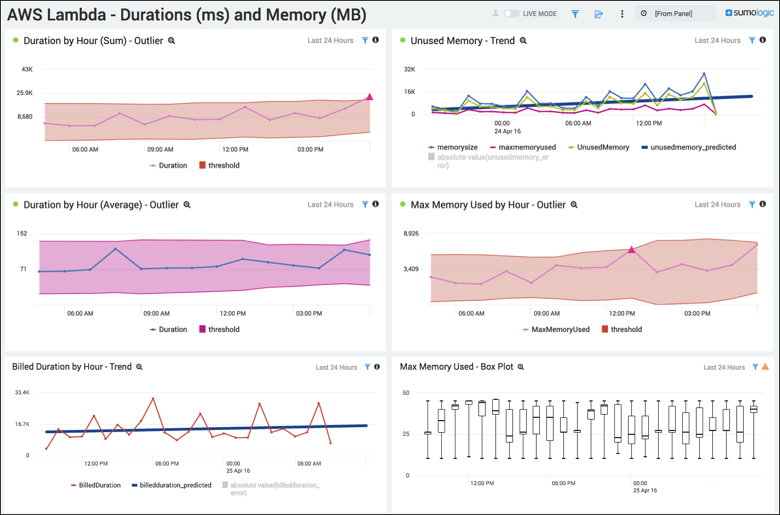
The Sumo Logic App for AWS Lambda is great for monitoring your Lambda functions and gaining deeper visibility into performance and usage. Here are benefits:
- Track compute & memory usage: The Sumo Logic app tracks compute performance of individual Lambda functions and lets you drill down to the details. This is important because you configure resources in your code, and you need visibility at the individual function level to ensure all processes have adequate resources.
- Cost correlation: The Sumo Logic app translates granular performance data to actual billed costs. It lets you track usage of memory, and even excess memory in functions, and prevents overspending. It enables you to split expense across multiple teams if you need to. Based on past behavior, the app can even predict future performance and spend.
- Integrated reporting: If you already use Sumo Logic to monitor and manage the rest of your infrastructure stack, you can bring it all in one place, and have realistic benchmarks for your Lambda usage.
- Real-time stats: The data in your Sumo Logic dashboards streams in real-time from AWS, so you never have to worry about seeing outdated information.
- Advanced visualizations: Sumo Logic lets you slice and dice your data with advanced analytics tools. The dashboards contain various chart types, including advanced types like the box plot chart. This kind of analysis is simply not possible within AWS.
As you scale your usage of Lambda, you need deep monitoring that can correlate compute usage with costs. You’re used to having control and visibility over your server-driven apps using traditional monitoring tools. With Lambda, the approach to monitoring has changed, but your goals are the same—to gain visibility and efficiency into your app and the abstracted Lambda infrastructure. You need the right tools to enable this kind of monitoring.
About the Author
Twain began his career at Google, where, among other things, he was involved in technical support for the AdWords team. Today, as a technology journalist he helps IT magazines, and startups change the way teams build and ship applications.
Overview of AWS Lambda Monitoring is published by the Sumo Logic DevOps Community. If you’d like to learn more or contribute, visit devops.sumologic.com. Also, be sure to check out Sumo Logic Developers for free tools and code that will enable you to monitor and troubleshoot applications from code to production.

