Puppet is a software configuration management and deployment tool that is available both as an open source tool and commercial software. It’s most commonly used on Linux and Windows to pull the strings on multiple application servers at once. It includes its own declarative language to describe system configurations. In today’s cloud environments that consist of hundreds of distributed machines, Puppet can help in reducing development time and resources by automatically applying these configurations.

Just like any other DevOps tool there can be errors and configuration issues. However, with the new Sumo Logic Puppet integration and application, customers can now leverage the Sumo Logic platform to help monitor Puppet performance, configurations and errors.
Puppet Architecture and Logging
Puppet can apply required configurations across new and existing servers or nodes. You can configure systems with Puppet either in a client-server architecture or in stand-alone architectures. The client-server architecture is the most commonly used architecture for Puppet implementations.
Puppet agents apply the required changes and send the reports to the Puppet master describing the run and details of the client resources. These reports can help answer questions like “how often are the resources modified,” “how many events were successful in the past day” and “what was the status of the most recent run?”

In addition to reports, Puppet also generates an extensive set of log files. From a reporting and monitoring perspective, the two log files of interest are the Puppet server logs and the HTTP request logs.
Puppet server messages and errors are logged to the file /var/log/puppetlabs/puppetserver/puppetserver.log. Logging can be configured using the /etc/puppetlabs/puppetserver/logback.xml file, which can be used to monitor the health of the server.
The /var/log/puppetlabs/puppetserver/puppetserver-access.log file contains HTTP traffic being routed via your Puppet deployment. This logging can be handled using the configuration file:
/etc/puppetlabs/puppetserver/request-logging.xml. Puppet agent requests to the master are logged into this file.
Sumo Logic Puppet App
The Sumo Logic Puppet app is designed to effectively manage and monitor Puppet metrics, events and errors across your deployments. With Sumo Logic dashboards you will be able to easily identify:
- Unique nodes
- Puppet node runs activity
- Service times
- Catalog application times
- Puppet execution times
- Resource transition (failures, out-of-sync, modifications, etc.)
- Error rates and causes
Installation
In order to get started, the app requires three data sources:
- Puppet server logs
- Puppet access logs
- Puppet reports
The puppet server logs and puppet access logs are present in the directory var/log/puppetlabs/puppetserver/. Configure separate local file resources for both of these log files.
Puppet reports are generated as yaml files. These need to be converted into JSON files before ingesting into Sumo Logic. To ingest Puppet reports, you must configure a script source.
Once the log sources are configured, the Sumo Logic app can be installed. Simply navigate to the apps Catalog in your Sumo Logic instance and add the Puppet app to the library after providing the sources configured in the previous step.
For more details on app configuration, please see instructions on Sumo Logic’s DocHub.
Sumo Logic Puppet App Visualizations
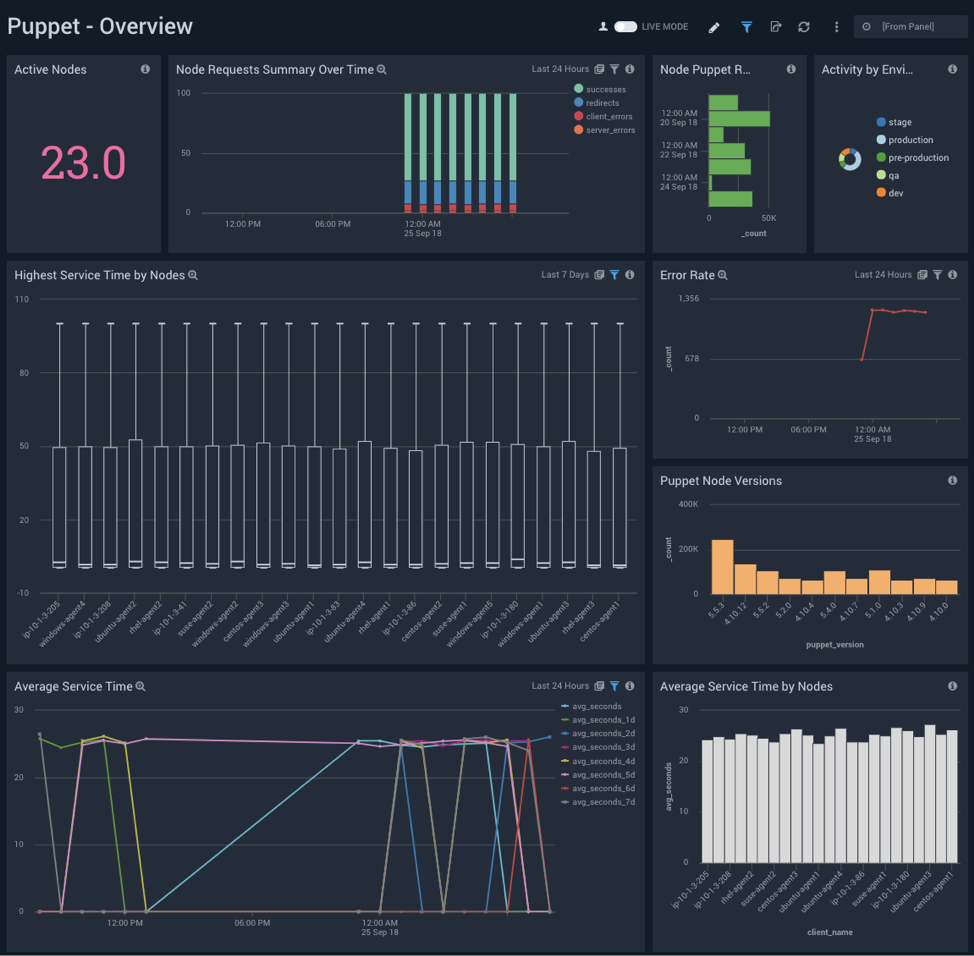
In any given Puppet deployment, there can be a large number of nodes. Some of the nodes may be faulty or others may be very active. The Puppet server manages the nodes and it may be suffering from issues itself. The Sumo Logic Puppet app consists of predefined dashboards and search queries which help you monitor the Puppet infrastructure. The Puppet Overview dashboard shown below gives you an overview of activity across nodes and servers.
If a Puppet node is failing, you can quickly find out when the node made requests, what version it is running on and how much time it is taking to prepare the catalog for the node by the server.
Puppet Overview Dashboard
Let’s take a closer look at the Error Rate panel.
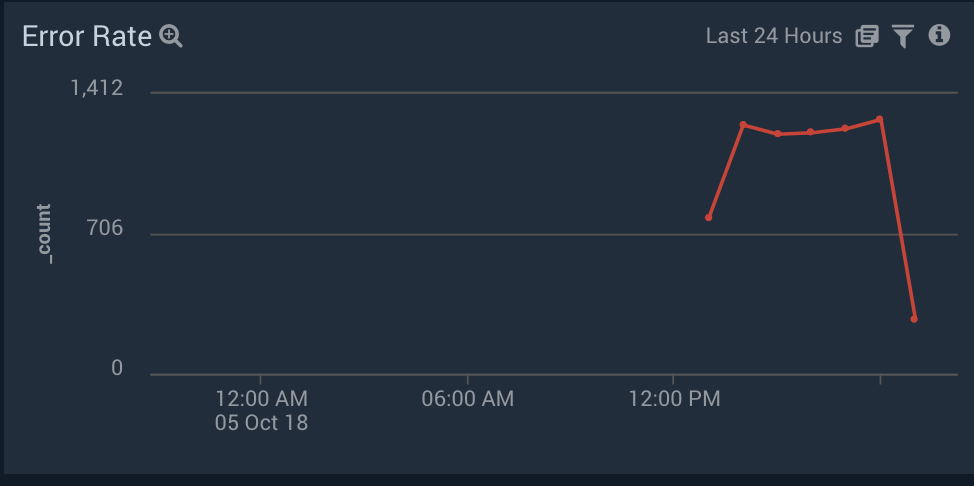
The Error Rate panel displays the error rates per hour. This helps identify when error rates spiked, and by clicking on the panel, you can identify the root cause on either the node-level or the server-level via the Puppet Error Analysis dashboard. In addition, this dashboard highlights the most erroneous nodes along with the most recent errors and warnings. With this information, it will be easier to drill down into the root cause of the issues.
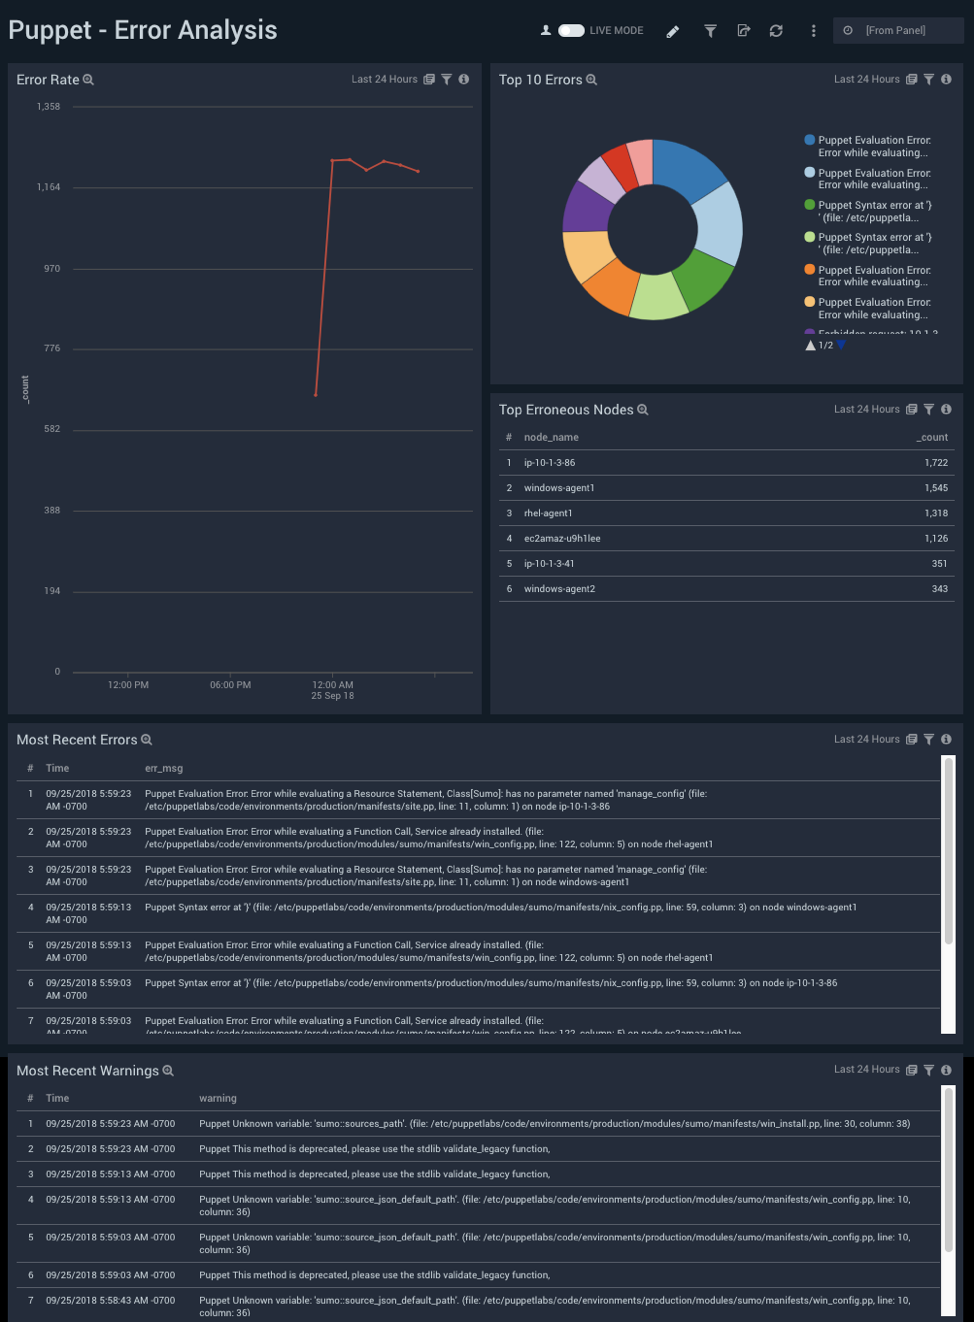
The panel Top Erroneous Nodes helps in identifying the most unstable nodes.
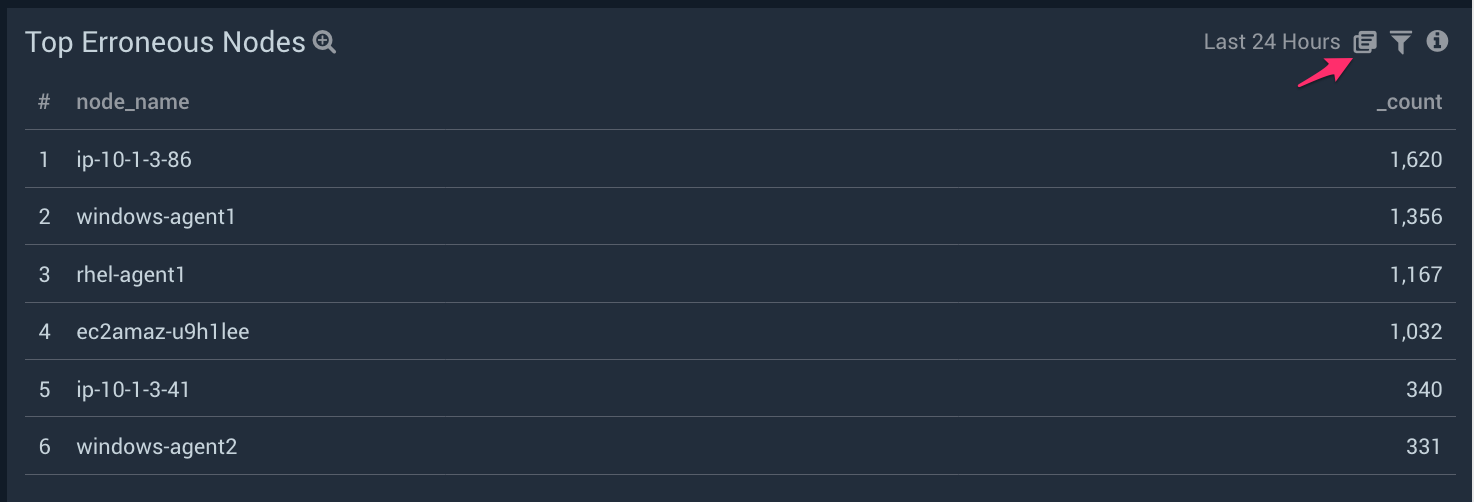
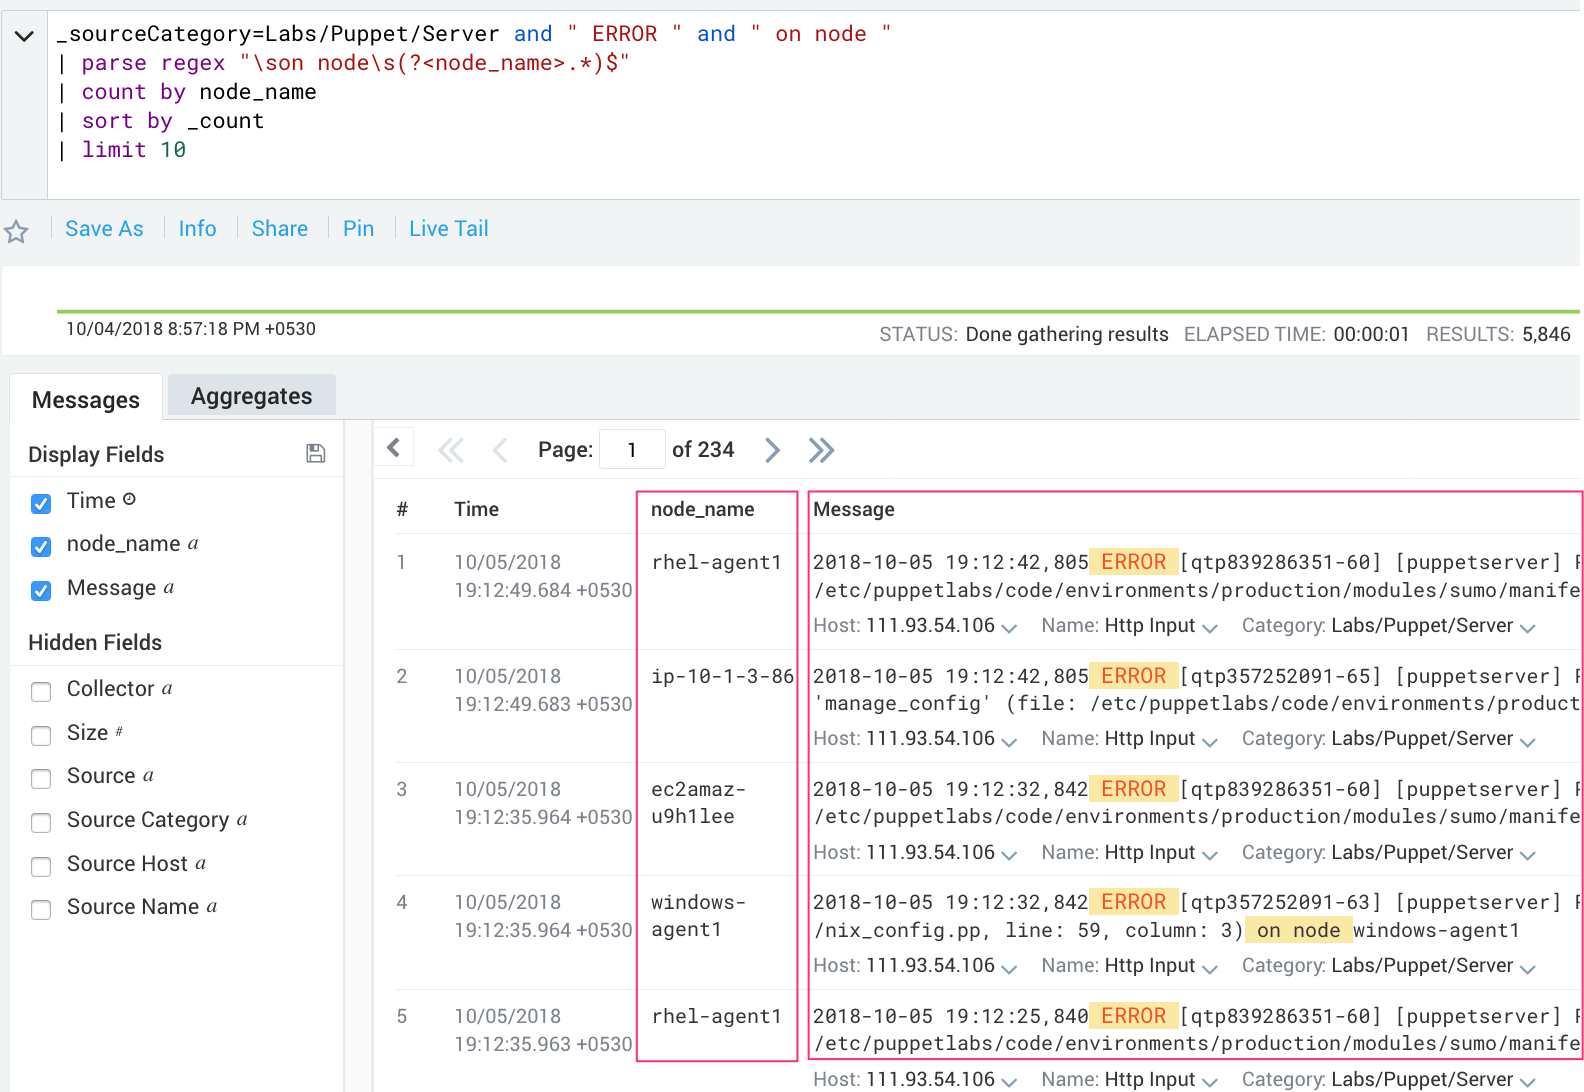
Drill down to view the search query by clicking on the “Show in Search” icon highlighted in the above screenshot. The node name and the errors can be easily identified and corrective actions can be performed by reviewing the messages in the search result as shown in the screenshot below:
With the help of information on the Puppet – Node Puppet Run Analysis dashboard, node health can be easily determined across different deployments such as production and pre-production. The “Slowest Nodes by Catalog Application Time” panel helps you determine the slowest nodes, which can potentially be indicative of problems and issues within those nodes. From there, you can reference the Puppet Error Analysis dashboard to determine the root cause. The “Resource Status” panel helps you quickly determine the status of various resources, further details around which can be obtained by drilling down to the query behind it.
By reviewing the panels on this dashboard, highest failing or out-of-sync resources can be easily determined, which may be indicative of problems on respective nodes.
To compare the average catalog application times, take a look at the “Average Catalog Application Time” and “Slowest Nodes by Catalog Application Time” panels.
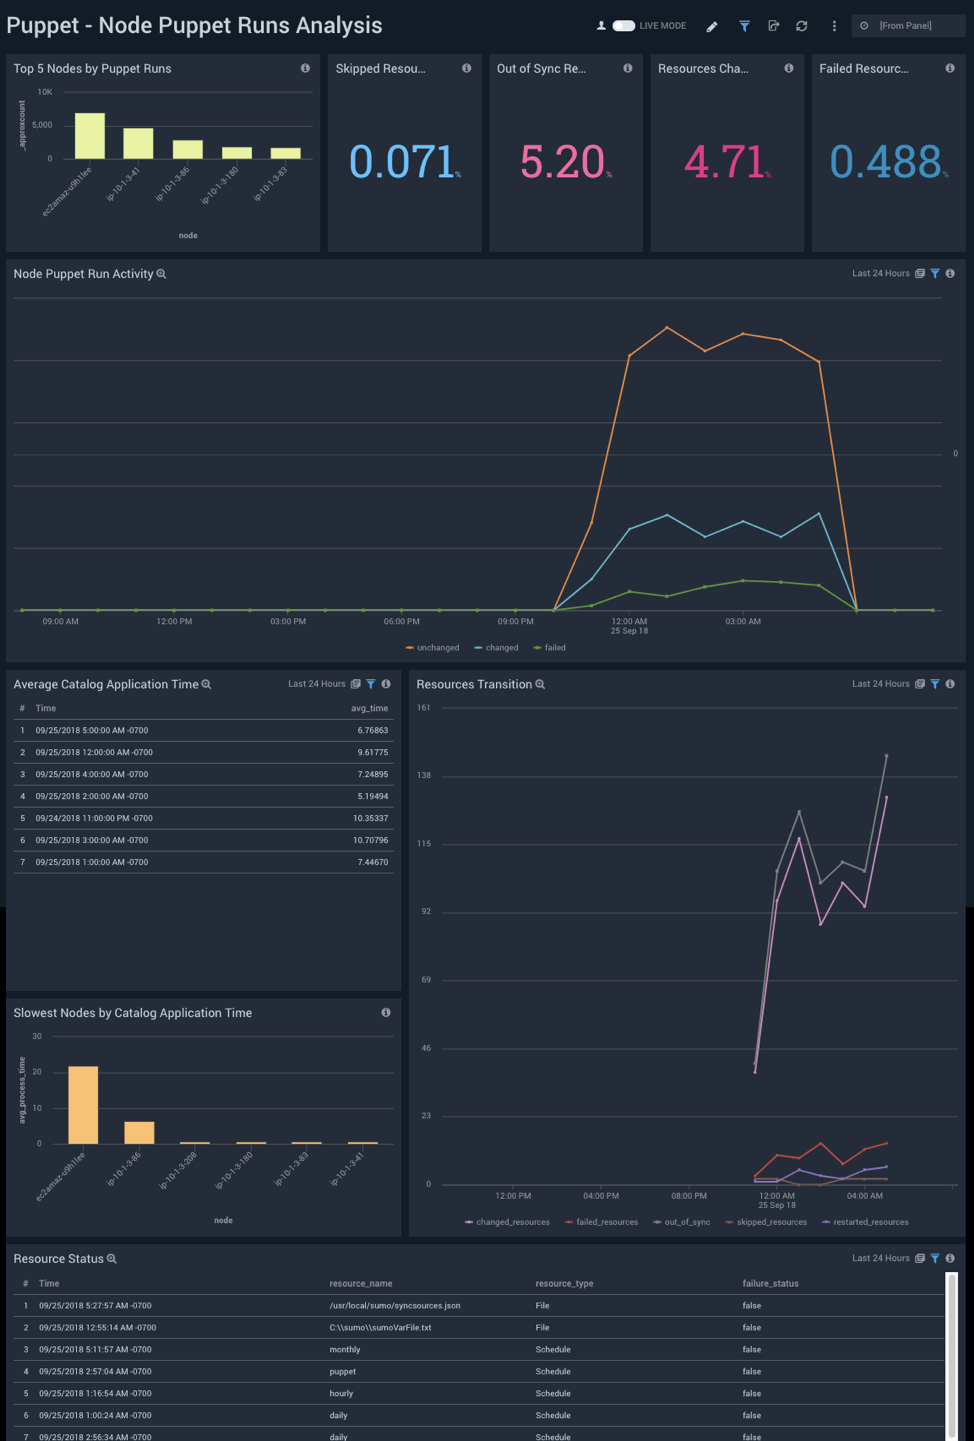
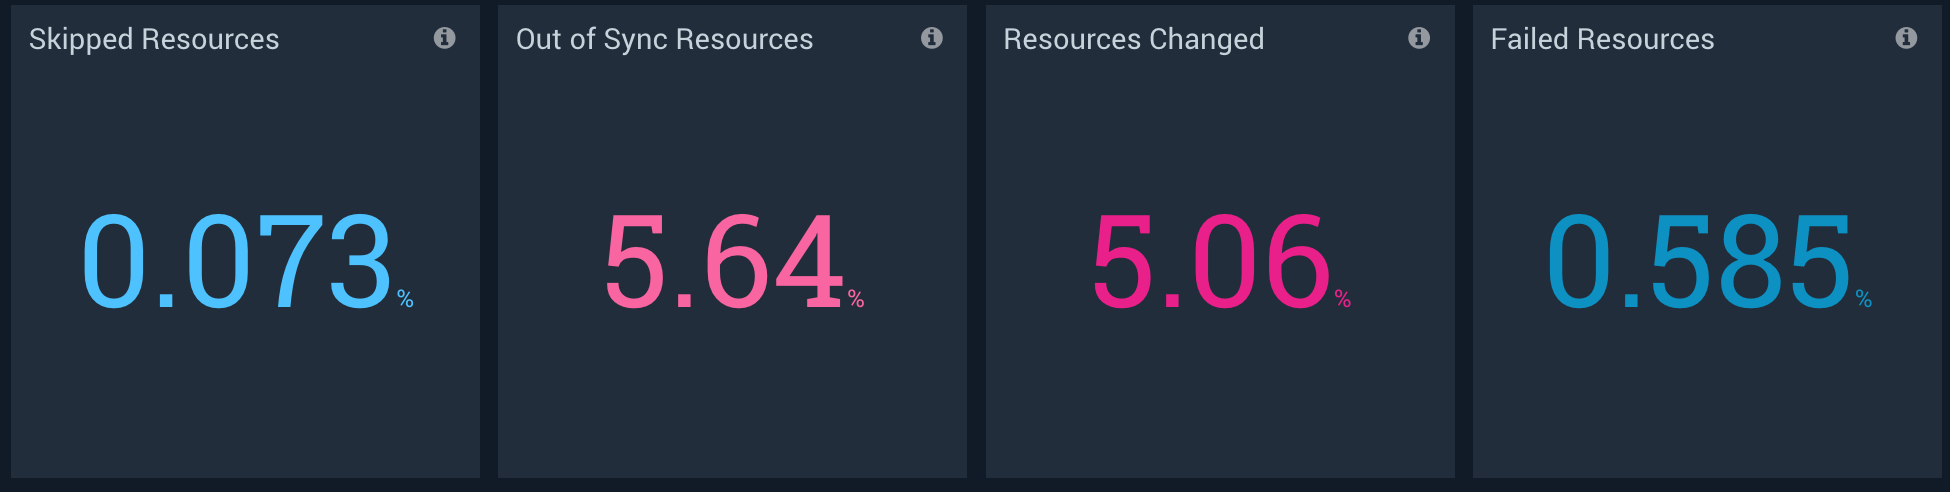
The resources panels show resources that failed, modified, are out-of-sync and skipped.
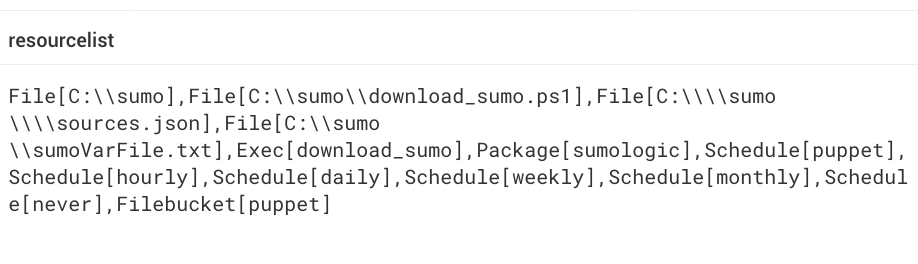
Drilling down to the queries of the panels will help in determining the exact resource list with the selected status.
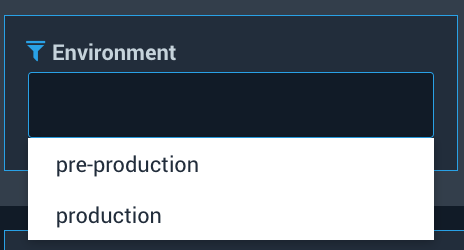
Note: All the panels in the Puppet Node Puppet Run Analysis dashboard and some panels of the Puppet Overview dashboard can be filtered based on the environment, such as production, pre-production, etc. as shown below:
Get Started Now!
The Sumo Logic app for Puppet monitors your entire Puppet infrastructure potentially spanning hundreds of nodes and helps determine the right corrective and preventative actions.
To get started check out the Sumo Logic Puppet app help doc. If you don’t yet have a Sumo Logic account, you can sign up for a free trial today.
For more great DevOps-focused reads, check out the Sumo Logic blog.
