In a previous blog post, we talked about Amazon Relational Database Service (RDS). RDS is one of the most popular cloud-based database services today and extensively used by Amazon Web Services (AWS) customers for its ease of use, cost-effectiveness and simple administration.
Although as a managed service, RDS doesn’t require database administrators (DBAs) to do many of the day-to-day tasks, it still needs to be monitored for performance and availability. That’s because Amazon doesn’t auto-tune any database performance — this is a shared responsibility of the customer.
That’s why there should be a monitoring strategy and processes in place for DBAs and operation teams to keep an eye on their RDS fleet. In this blog post, we will talk about an overall best-practice approach for doing this.
Why Database Monitoring
Keeping a database monitoring regimen in place, no matter how simple, can help address potential issues proactively before they become incidents, and cost additional time and money. Most AWS infrastructure teams typically have decent monitoring in place for different types of resources like EC2, ELB, Auto Scaling Groups, Logs, etc. Database monitoring often comes at a later stage or is ignored altogether. With RDS, it’s also easy to overlook due to the low-administration nature of the service. The DBA or the infrastructure managers should therefore invest some time in formulating and implementing a database monitoring policy.
Please note that designing an overall monitoring strategy is an involved process and is not just about defining database counters to monitor. It also includes areas like:
- Service Level Agreement
- Classifying incident types (Critical, Serious, Moderate, Low etc.)
- Creating RACI (Responsible, Accountable, Consulted, Informed) matrix
- Defining escalation paths etc..
A detailed discussion of all these topics is beyond the scope of this article, so we will concentrate on the technical part only.
What to Monitor
Database monitoring, or RDS monitoring in this case, is not about monitoring only database performance. A monitoring strategy should include the following broad categories and their components:
| Monitoring category | Examples of what to monitor |
| Availability |
|
| Recoverability |
|
| Health and Performance |
|
| Manageability |
|
| Security |
|
| Cost |
|
While many of these things can be monitored directly in AWS, Sumo Logic can greatly help with understanding all of the logs and metrics that RDS produces.
In this article, we will talk about what AWS offers for monitoring RDS. As we go along, we will point out where we think Sumo Logic can make the work easier.
Monitoring Amazon CloudWatch
You can start monitoring RDS using metrics from Amazon CloudWatch. Amazon RDS, like any other AWS service, exposes a number of metrics which are available through CloudWatch. There are three ways to access these metrics:
- From AWS Console
- Using AWS CLI
- Using REST APIs
The image below shows some of these metrics from the RDS console:
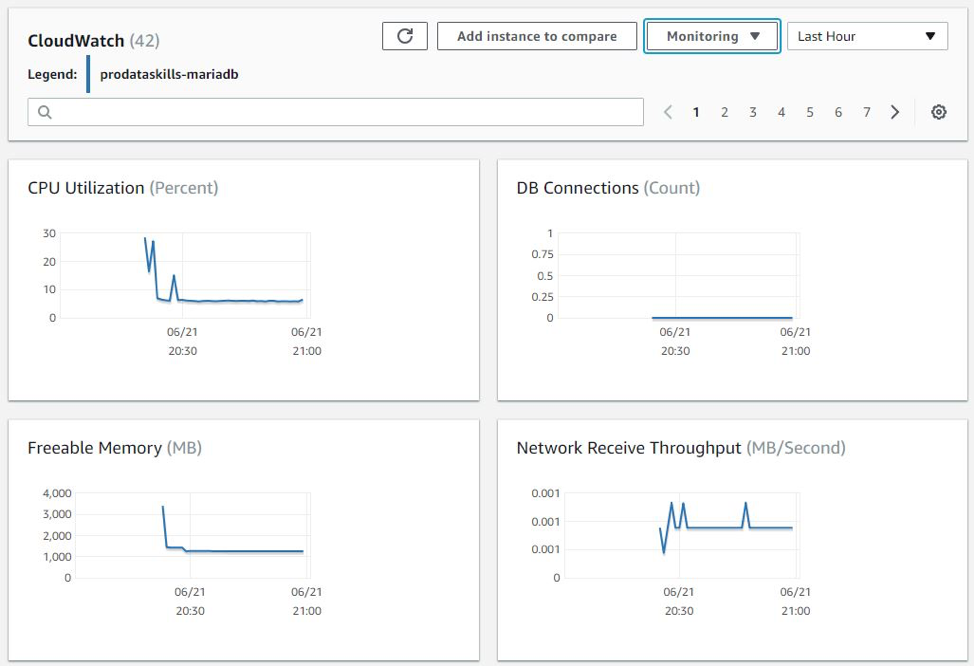
Amazon CloudWatch shows two types of RDS metrics:
- Built-in Metrics
- Enhanced Monitoring Metrics
Built-in Metrics
These metrics are available from any RDS instance. They are collected from the hypervisor of the host running the RDS virtual machine. Some of the metrics may not be available for all database engines, but the important ones are common.
It is recommended the following RDS metrics are monitored from CloudWatch
| Metric | What it means | Why you should monitor it |
| CPUUtilization | % CPU load in the RDS instance. | A consistent high value means one or more processes are waiting for CPU time while one or more processes are blocking it. |
| DiskQueueDepth | The number of input and output requests waiting for the disk resource. | A consistent high value means disk resource contention – perhaps due to locking, long running update queries etc. |
| DatabaseConnections | The number of database connections against the RDS instance. | A sudden spike should be investigated immediately. It may not mean a DDOS attack, but a possible issue with the application generating multiple connections per request. |
| FreeableMemory | The amount of RAM available in the RDS instance, expressed in bytes. | A very low value means the instance is under memory pressure. |
| FreeStorageSpace | Amount of disk storage available in bytes. | A small value means disk space is running out. |
| ReadIOPS | The average number of disk read operations per second. | Should be monitored for sudden spikes. Can mean runaway queries. |
| WriteIOPS | The average number of disk write operations per second. | Should be monitored for sudden spikes. Can mean a very large data modification |
| ReadLatency | The average time in milliseconds to perform a read operation from the disk. | A higher value may mean a slow disk operation, probably caused by locking. |
| WriteLatency | The average time in milliseconds to perform a write operation to disk. | A higher value may means disk contention. |
| ReplicaLag | How far in time, the read replica of MySQL, MariaDB or PostgreSQL instance is lagging behind from its master | A high lag value can means read operations from replica is not serving the current data. |
Amazon RDS Aurora engine also exposes some extra counters which are really useful for troubleshooting. At the time of writing, Aurora supports MySQL and PostgreSQL only. We recommend monitoring these counters:
| Metric | What it means | Why you should monitor it |
| DDLLatency | The average time in milliseconds to complete Data Definition Language (DDL) commands like CREATE, DROP, ALTER etc. | A high value means the database is having performance issues running DDL commands. This can be due to exclusive locks on objects. |
| SelectLatency | The average time in milliseconds to complete SELECT queries. | A high value may mean disk contention, poorly written queries, missing indexes etc. |
| InsertLatency | The average time in milliseconds to complete INSERT commands. | A high value may mean locking or poorly written INSERT command. |
| DeleteLatency | The average time in milliseconds to complete DELETE commands. | A high value may mean locking or poorly written DELETE command. |
| UpdateLatency | The average time in milliseconds to complete UPDATE commands. | A high value may mean locking or poorly written UPDATE command. |
| Deadlocks | The average number of deadlocks happening per second in the database. | More than 0 should be a concern – it means the application queries are running in such a way that they are blocking each other frequently. |
| BufferCacheHitRatio | The percentage of queries that can be served by data already stored in memory | It should be a high value, near 100, meaning queries are don’t have to access disk for fetching data. |
| Queries | The average number of queries executed per second | This should have a steady, average value. Any sudden spike or dip should be investigated. |
You can use the AWS documentation for a complete list of built-in RDS metrics.
Enhanced Monitoring Metrics
RDS also exposes “enhanced monitoring metrics.” These are collected by agents running on the RDS instances’ operating system. Enhanced monitoring can be enabled when an instance is first created or it can be enabled later. It is recommended enabling it because it offers a better view of the database engine.
Like built-in metrics, enhanced metrics are available from the RDS console. Unlike built-in metrics though, enhanced metrics are not readily accessible from CloudWatch Metrics console. When enhanced monitoring is enabled, CloudWatch creates a log group called RDSOSMetrics in CloudWatch Logs:
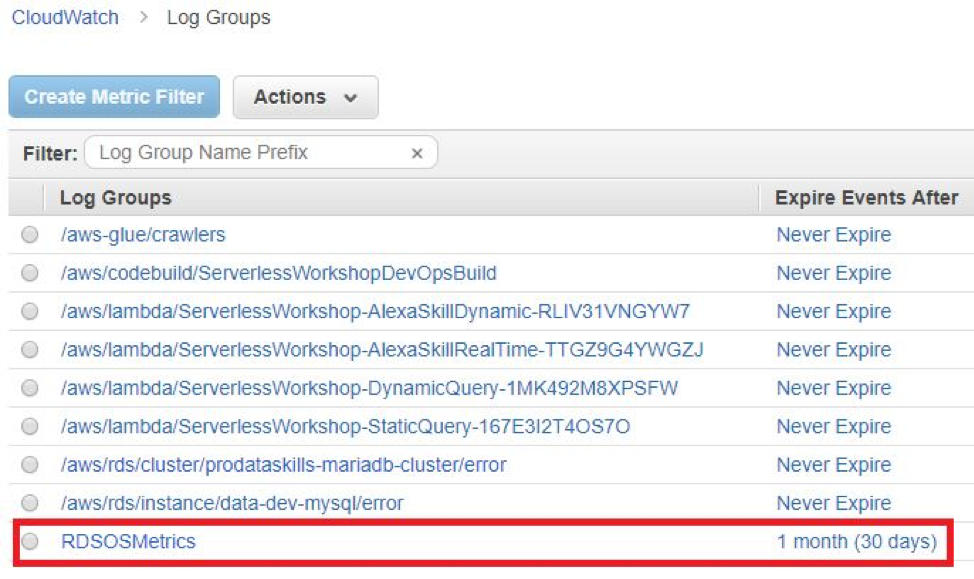
Under this log group, there will be a log stream for each RDS instance with enhanced monitoring. Each log stream will contain a series of JSON documents as records. Each JSON document will show a series of metrics collected at regular intervals (by default every minute). Here is a sample excerpt from one such JSON document:
| { “engine”: “Aurora”, “instanceID”: “prodataskills-mariadb”, “instanceResourceID”: “db-W4JYUYWNNIV7T2NDKTV6WJSIXU”, “timestamp”: “2018-06-23T11:50:27Z”, “version”: 1, “uptime”: “2 days, 1:31:19”, “numVCPUs”: 2, “cpuUtilization”: { “guest”: 0, “irq”: 0.01, “system”: 1.72, “wait”: 0.27, “idle”: 95.88, “user”: 1.91, “total”: 4.11, “steal”: 0.2, “nice”: 0 },…… |
It’s possible to create custom CloudWatch metrics from these logs and view those metrics from CloudWatch console. This will require some extra work. However, both built-in and enhanced metrics can be streamed to Sumo Logic from where you can build your own charts and alarms. Regardless of platform, it is recommended to monitor the enhanced metrics for a more complete view of the RDS database engine.
The following counters should be monitored for Amazon Aurora, MySQL, MariaDB, PostgreSQL, or Oracle:
| Metric Group | Metric | What it means and why you should monitor |
| cpuUtilization | user | % of CPU used by user processes. |

