
Every event must be logged either due to business or compliance requirement. Yes, that’s right – these days we all want to capture everything happening within applications. Well, it’s not bad things but it has pros and cons. You know the pros – you are getting all the required logs you want but side effects of this is, you have hell lot of logs/data which is difficult to analyze. For small business, it might be ok to look into few MB’s of logs. But if you are running medium size or global business then it’s just impossible to analyze all the captured logs and eventually goes to tape backup and kept there for many years.
Sumo Logic is not the only company who solves this problem but it’s one of the best in the industries. It helps to transform daily operations into intelligent business decisions. It has large number of application log analyzer, which helps you to save time on writing complex queries to extract the data.
List of log analyzer as I write:
- Linux Log Analyzer
- Nginx Log Analyzer
- IIS Log Analyzer
- Apache Log Analyzer
- Windows Log Analyzer
- Cisco Log Analyzer
- MySQL Log Analyzer
- Docker Log Analyzer
- AWS CloudTrail Log Analyzer
- Amazon S3 Log Analyzer
- Amazon Cloudfront Log Analyzer
- AWS Elastic LB Log Analyzer
- Akamai Log Analyzer
- Box Log Analyzer
- PIC Compliance Log Analyzer
- Microsoft Windows AD Log Analyzer
- VMware Log Analyzer
- Varnish Log Analyzer
- Adobe Connect Log Analyzer
- Hyperguard Log Analyzer
- Mac OS X Log Analyzer
- OSSEC Log Analyzer
- Palo Alto Networks Log Analyzer
- Postfix Log Analyzer
- Quickstart Log Analyzer
- StatsD Log Analyzer
- SourceFire and Snort IDS Log Analyzer
So now you probably thinking some of the above analyzer will fit your requirements. Best thing about Sumologic is – they allow you to analyze your logs on cloud and as well as locally. Below picture will give you an idea how it works over cloud.
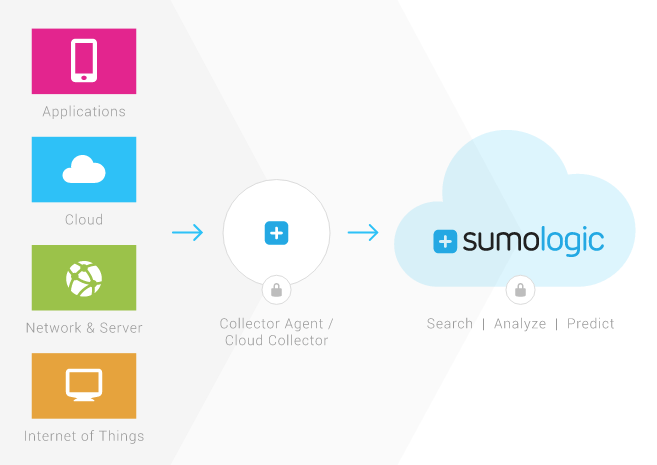
This means in order to use Sumologic cloud, you need to have their collector agent/cloud collector running on your server. Collector agent is available for Linux, Mac OS X, Solaris and Windows OS.
It’s time to show you how to analyze NGINX logs using Sumologic.
Pre-requisite
- You need to register an account with company email
- Must have at-least 128 MB memory on your server to run Collector Agent (Only for cloud)
I assume you have registered your account and ready to start analyzing the logs.
- Login into Sumologic and you should see following welcome screen
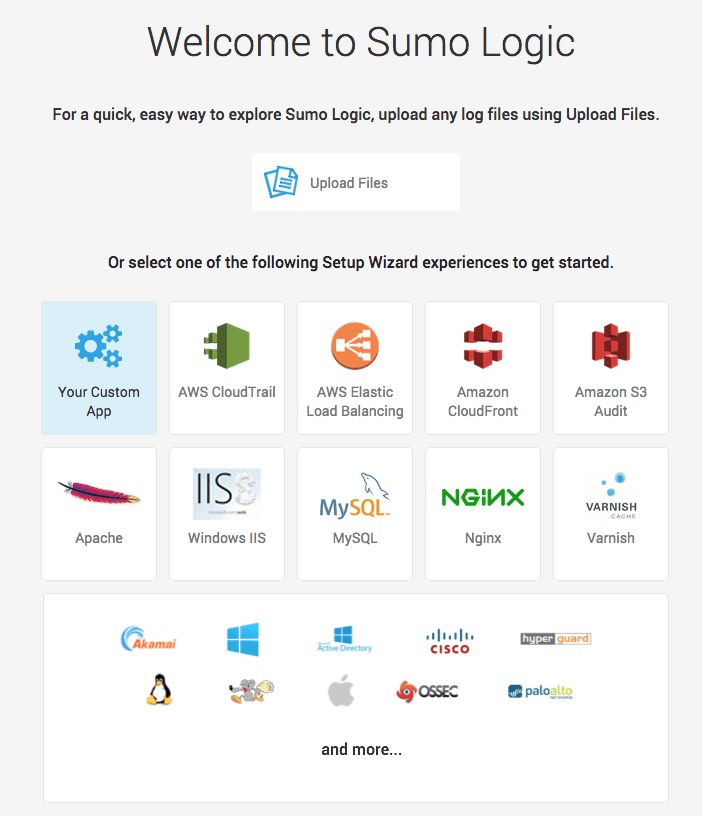
- Here you have an option to select if you wish to analyze local files or over cloud.
- Click on Upload Files to analyze the local files
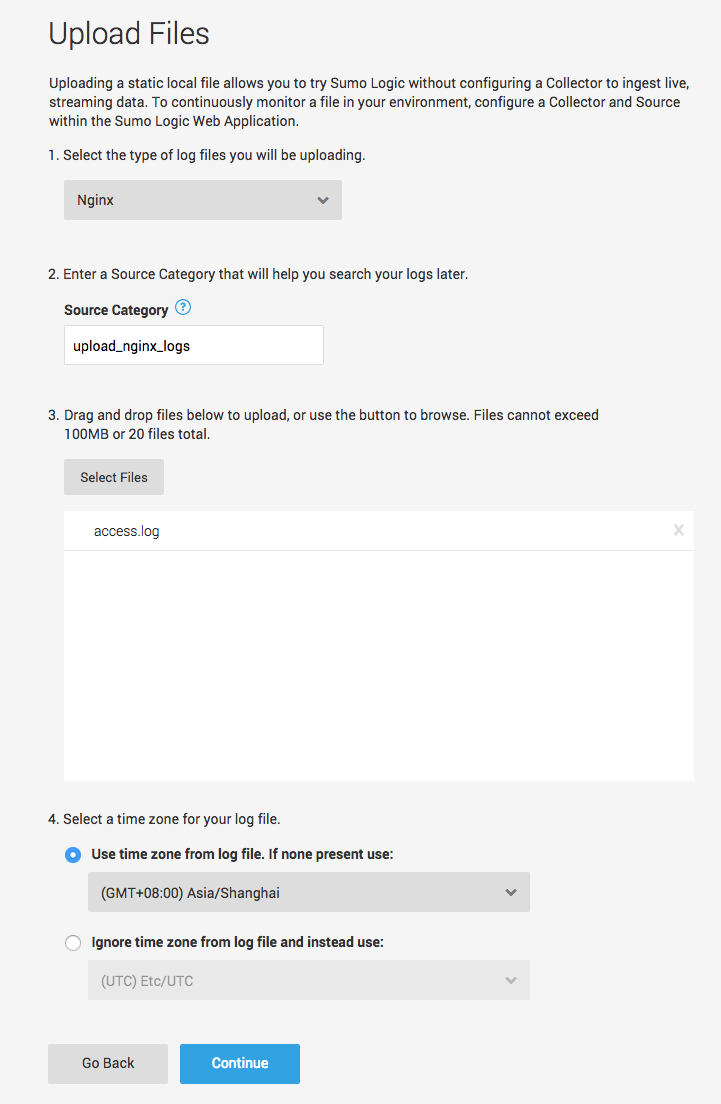
- Select the log type as nginx
- Click on Select Files to select the access log
- Select the time zone for your log file
- Click on Continue
- It will take few minutes to upload (depends on log file size) and at the end you will have an option to view dashboard
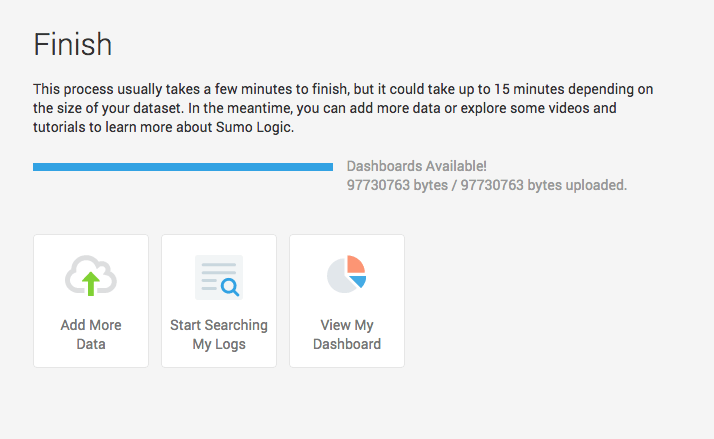
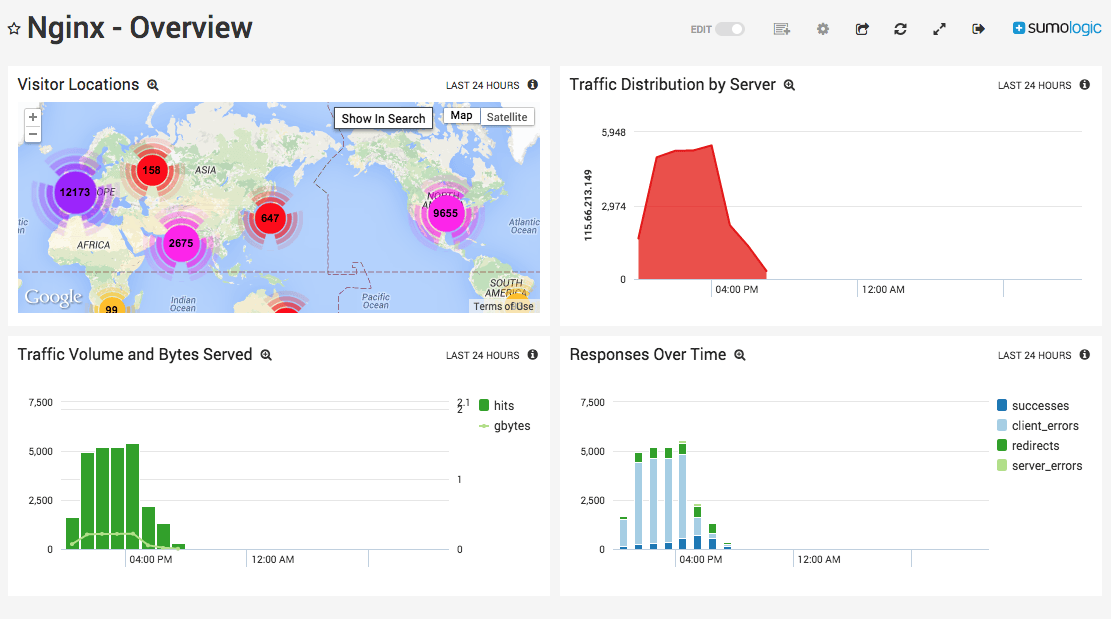
Click on View My Dashboard to see the overview of visitor locations, traffic volume, and response over time, etc.
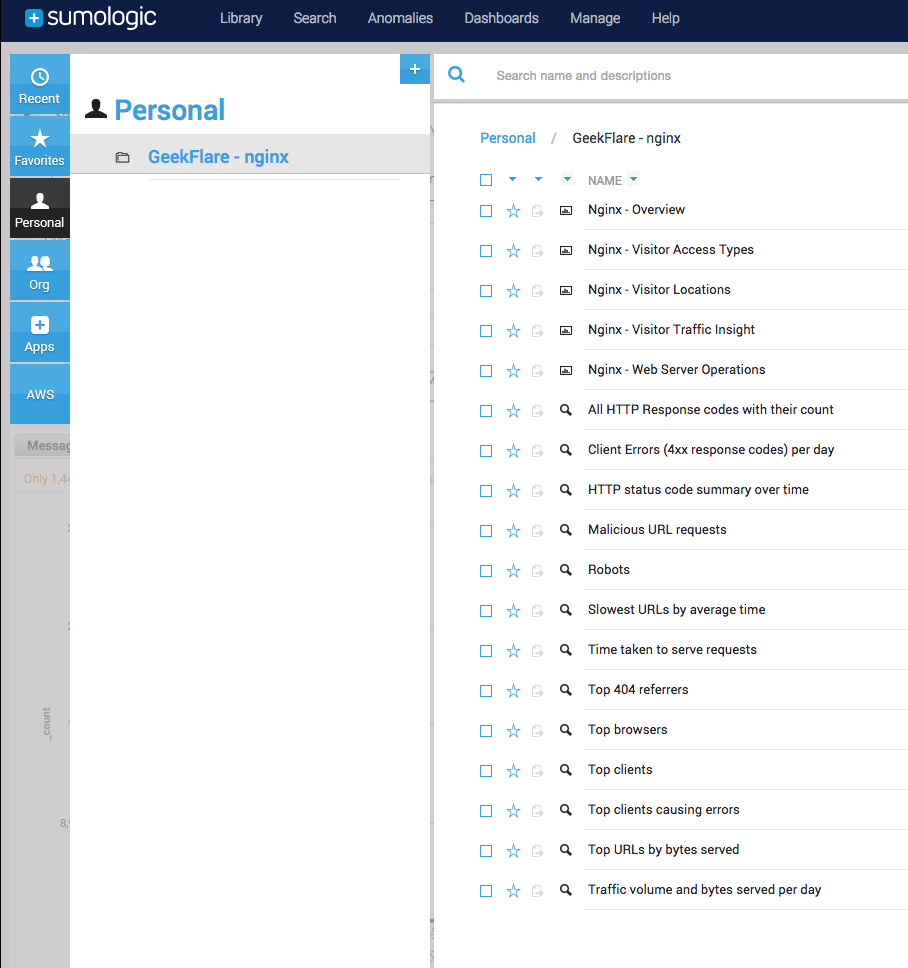
Let’s take a look at some of the out of box features to analyze the logs. These are available under Library menu.
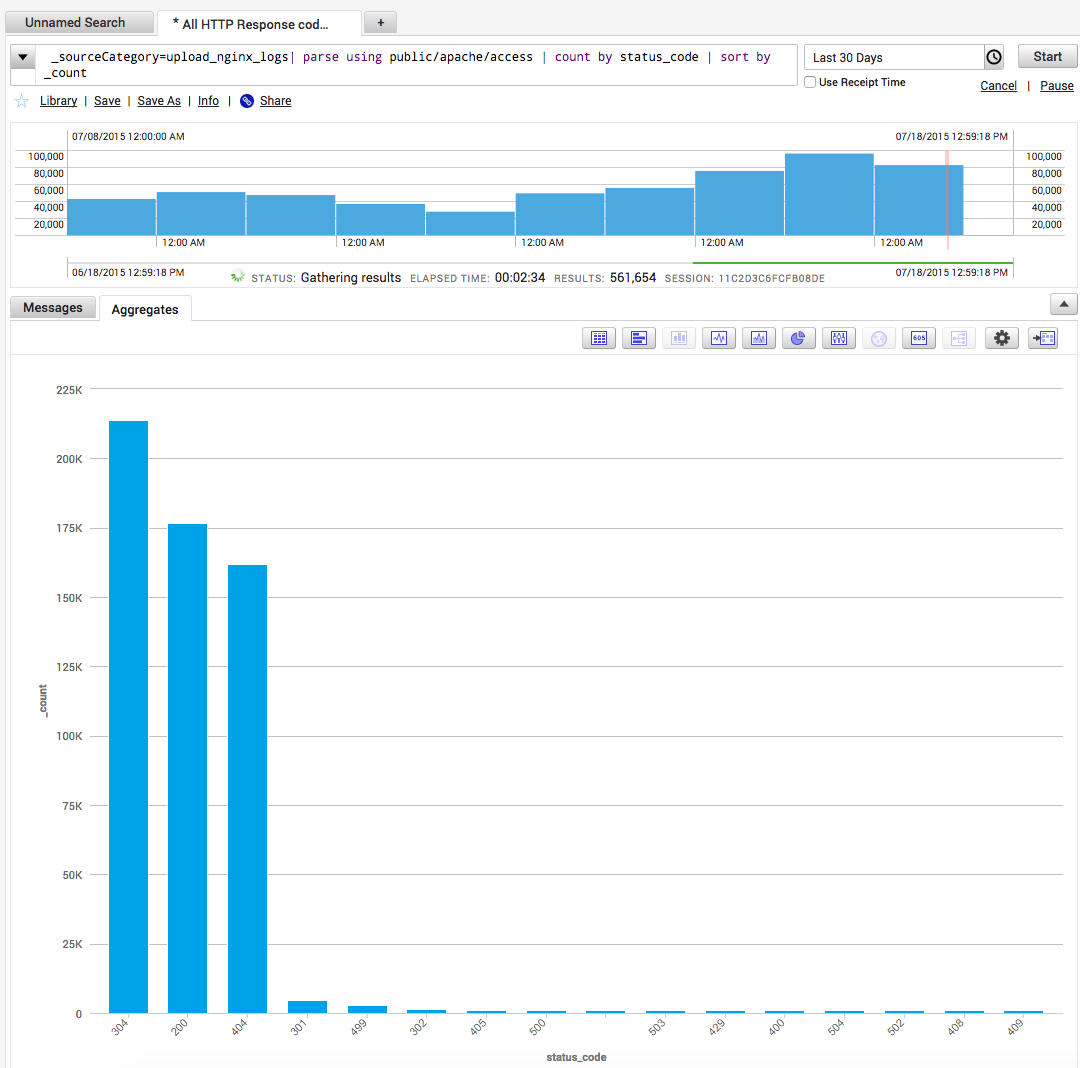
All HTTP Response codes with their count
One of the first few things you want to analyze in your web server log is HTTP response code to understand if you are wasting server resources in serving 40x or 50x error.
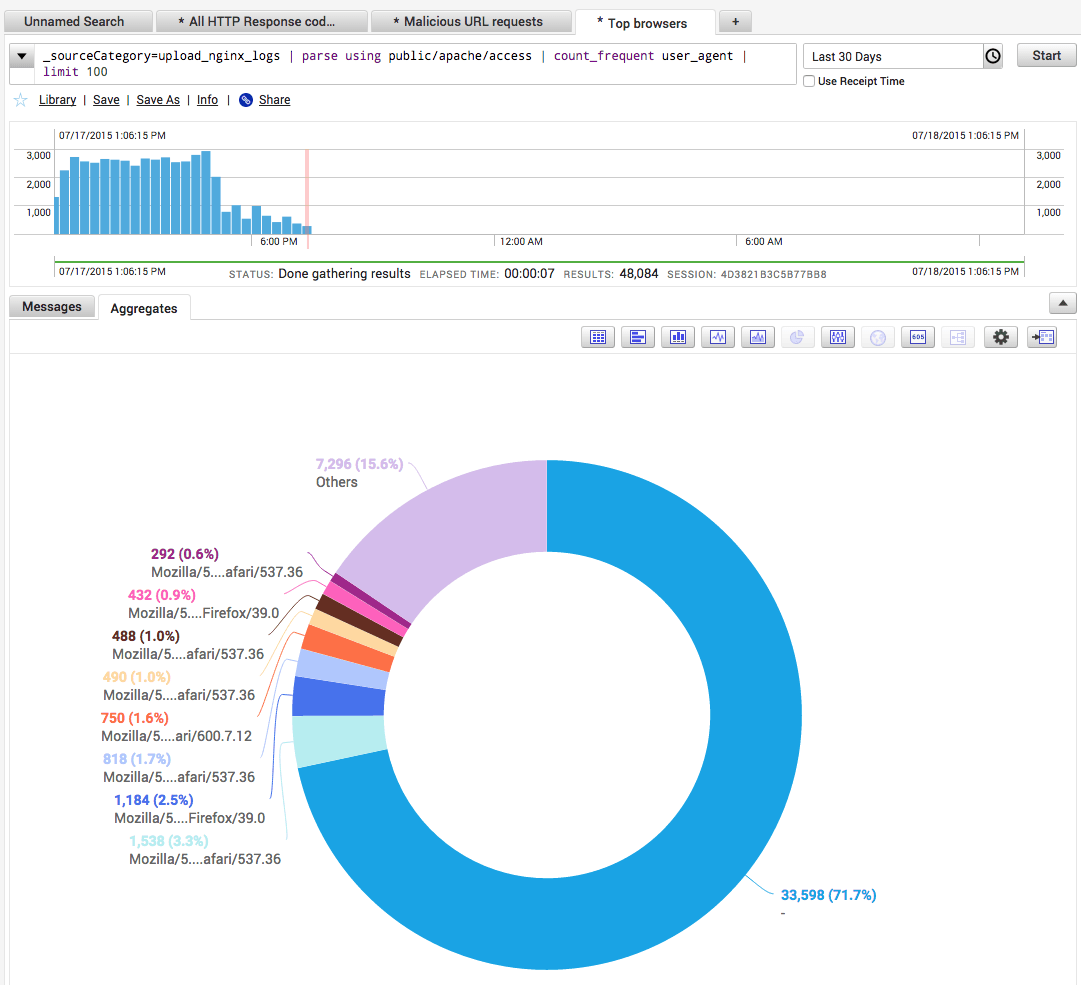
Top browsers
Media Type Served
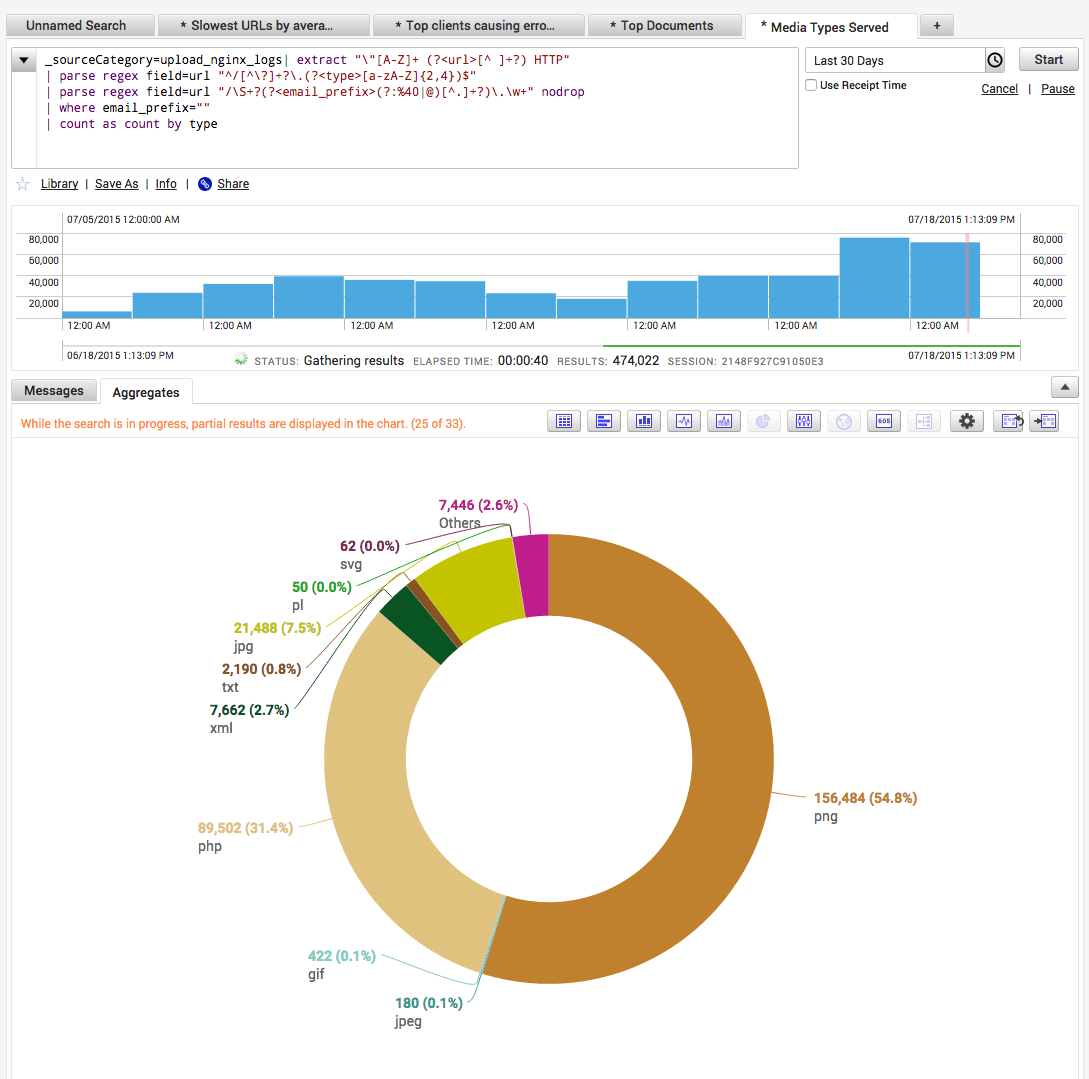
Top Referrers
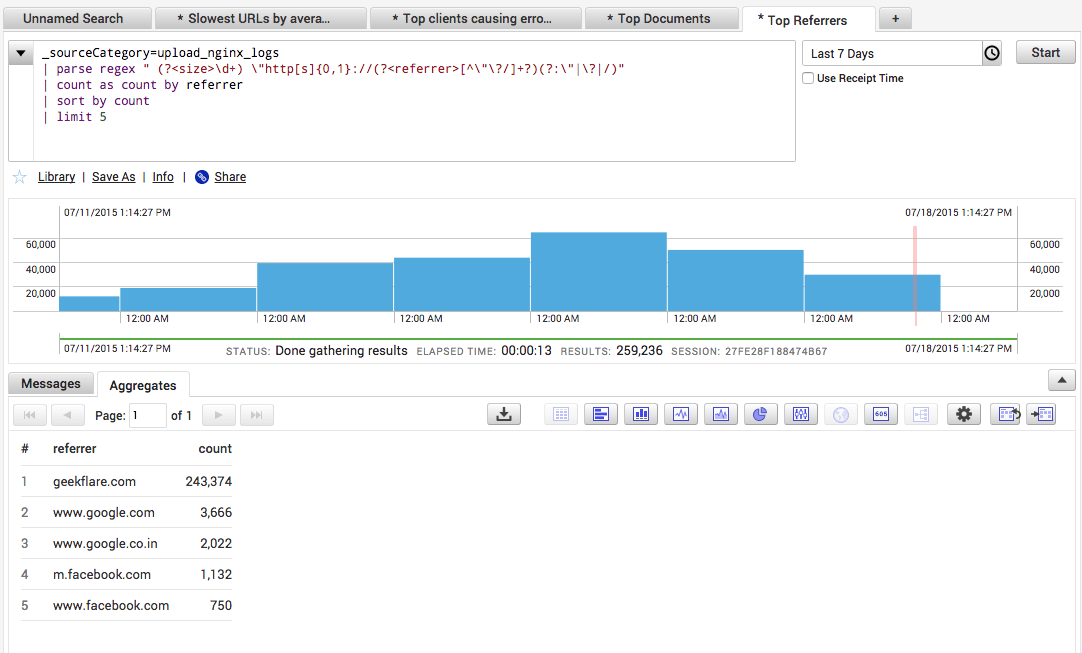
Above are just to given you an idea that you can have a meaningful insight report of your web application which will help you to focus on what you want and help the business. Moreover, you can perform custom search and have complete control on timeline, reporting chart, data drill-down and save searched items to dashboard for future reference.
I will use this to analyze following for Geek Flare. How about you?
- Analyze 40x & 50x HTTP status return code
- Analyze IP causing lots of 40x & 50x requests
- Analyze client’s browser
- Analyze response time
- Analyze robots
