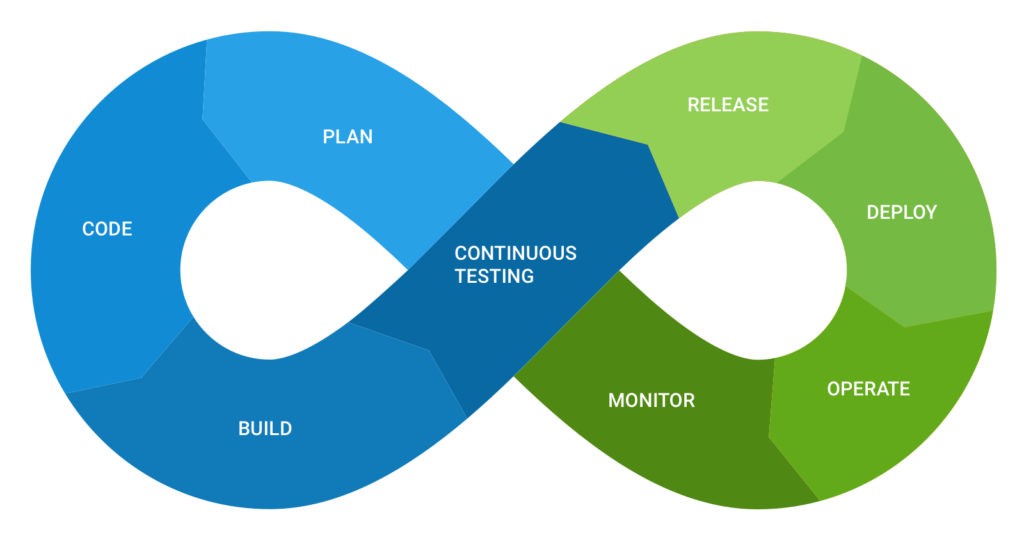
Continuous testing has evolved to become an important phase in modern application development and delivery.
When we at Sumo Logic sketched out a plan to start delivering our microservices continuously, we knew we needed to define a delivery pipeline, which would run our automated tests and provide feedback in early phases of development.
As we evolved and started running thousands of tests based on dependency graph, we observed two key things:
- The frequency of our tests had increased, hence the failures were more frequent. On an average, the failure rate per deploy increased by 20 percent to 30 percent.
- With the same test job triggered from multiple services, it was getting difficult to track intermittent failures.
We had a designated person within the team (popularly referred to as a “sheriff” at Sumo Logic) whose primary responsibility was to triage all Jenkins test failures. This person focused on finding out the reason for the failing jobs and then took necessary actions. It was easy to focus on failing jobs when there were minimum failures and at first, we did not pay sufficient attention to intermittent failures.

But as we progressed, we realized knowing failures for intermittent jobs was also important because they help us do the following:
- Understand customer experience during an upgrade/downtime
- Track an issue, which might be occurring randomly
- Help improve overall test scripts
For identifying the intermittent failing issues, the sheriff would do the below steps for one job:
- Open that Jenkins job
- Remember what was the last Jenkins run triaged
- Check the status of all the runs from that run onwards, until present
- If everything is green, then his work is done for that job
- If there are intermittent failures, he would pick each intermittent failure and investigate its root cause
Those above steps were repeated for 500 jobs in our case. Eventually we realized this model of triaging was not scalable, and was more error prone. Any Jenkins sheriff could easily miss out on some of the failed runs. Also, there were times when we realized all the failures could be summed up in a single reason, but that regardless, the sheriff still had to investigate all jobs to make sure that there was truly only one reason for failure, which was ineffective, time-consuming and not sustainable long term.

How Did We Solve This Problem?
When we considered all of the above challenges, we knew we wanted a solution that would:
- Give us a single, unified view for all failing runs
- Help us group together all the jobs failing with a single reason
- Enable us to change the time range and apply filters
Step-by-Step Process:
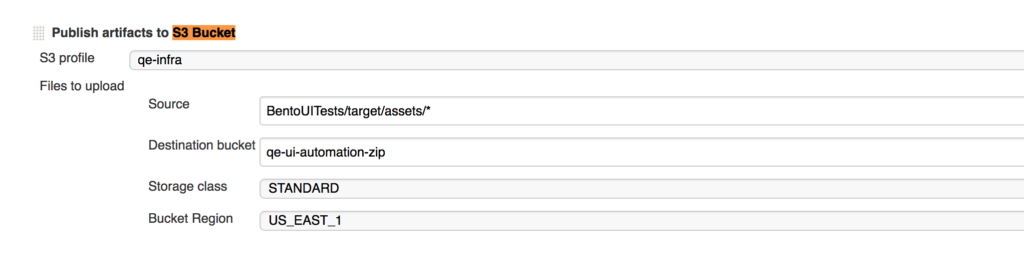
We started by uploading our test reports to an Amazon S3 bucket in a post-build action of every Jenkins job.These test reports had a JSON format and used Protractor as the testing framework. From there, we created a JSON report using the customized version of json reporter plugin.
Next, once we had all of the logs in place, we had to ingest them into Sumo Logic. For ingestion, we created an Amazon S3 source in one of our organizations.
Once the data started flowing in, all we had to do was to build custom dashboards on top on them.
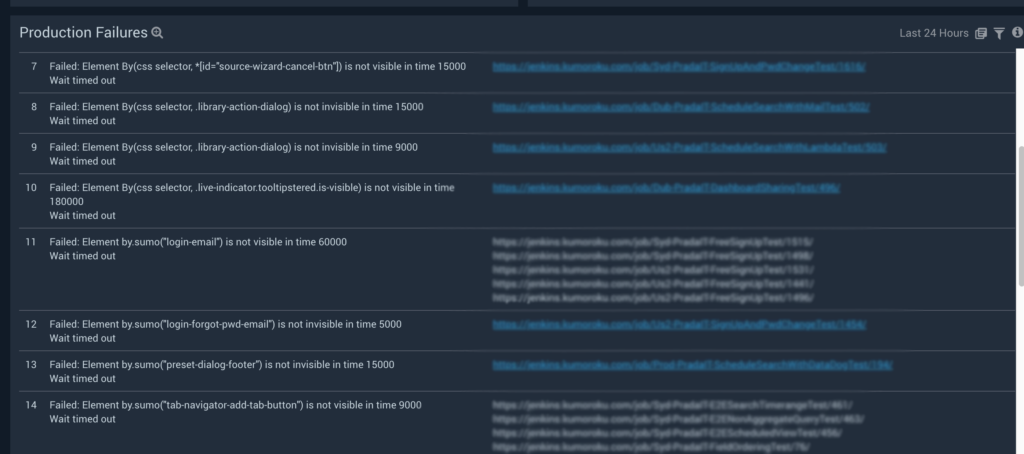
This dashboard panel gives us a bigger picture of all the Jenkins jobs failing on different production environments. It groups multiple Jenkins jobs failing because of a single failure into one, thus reducing the cumbersome manual effort it previously took to triage different jobs.
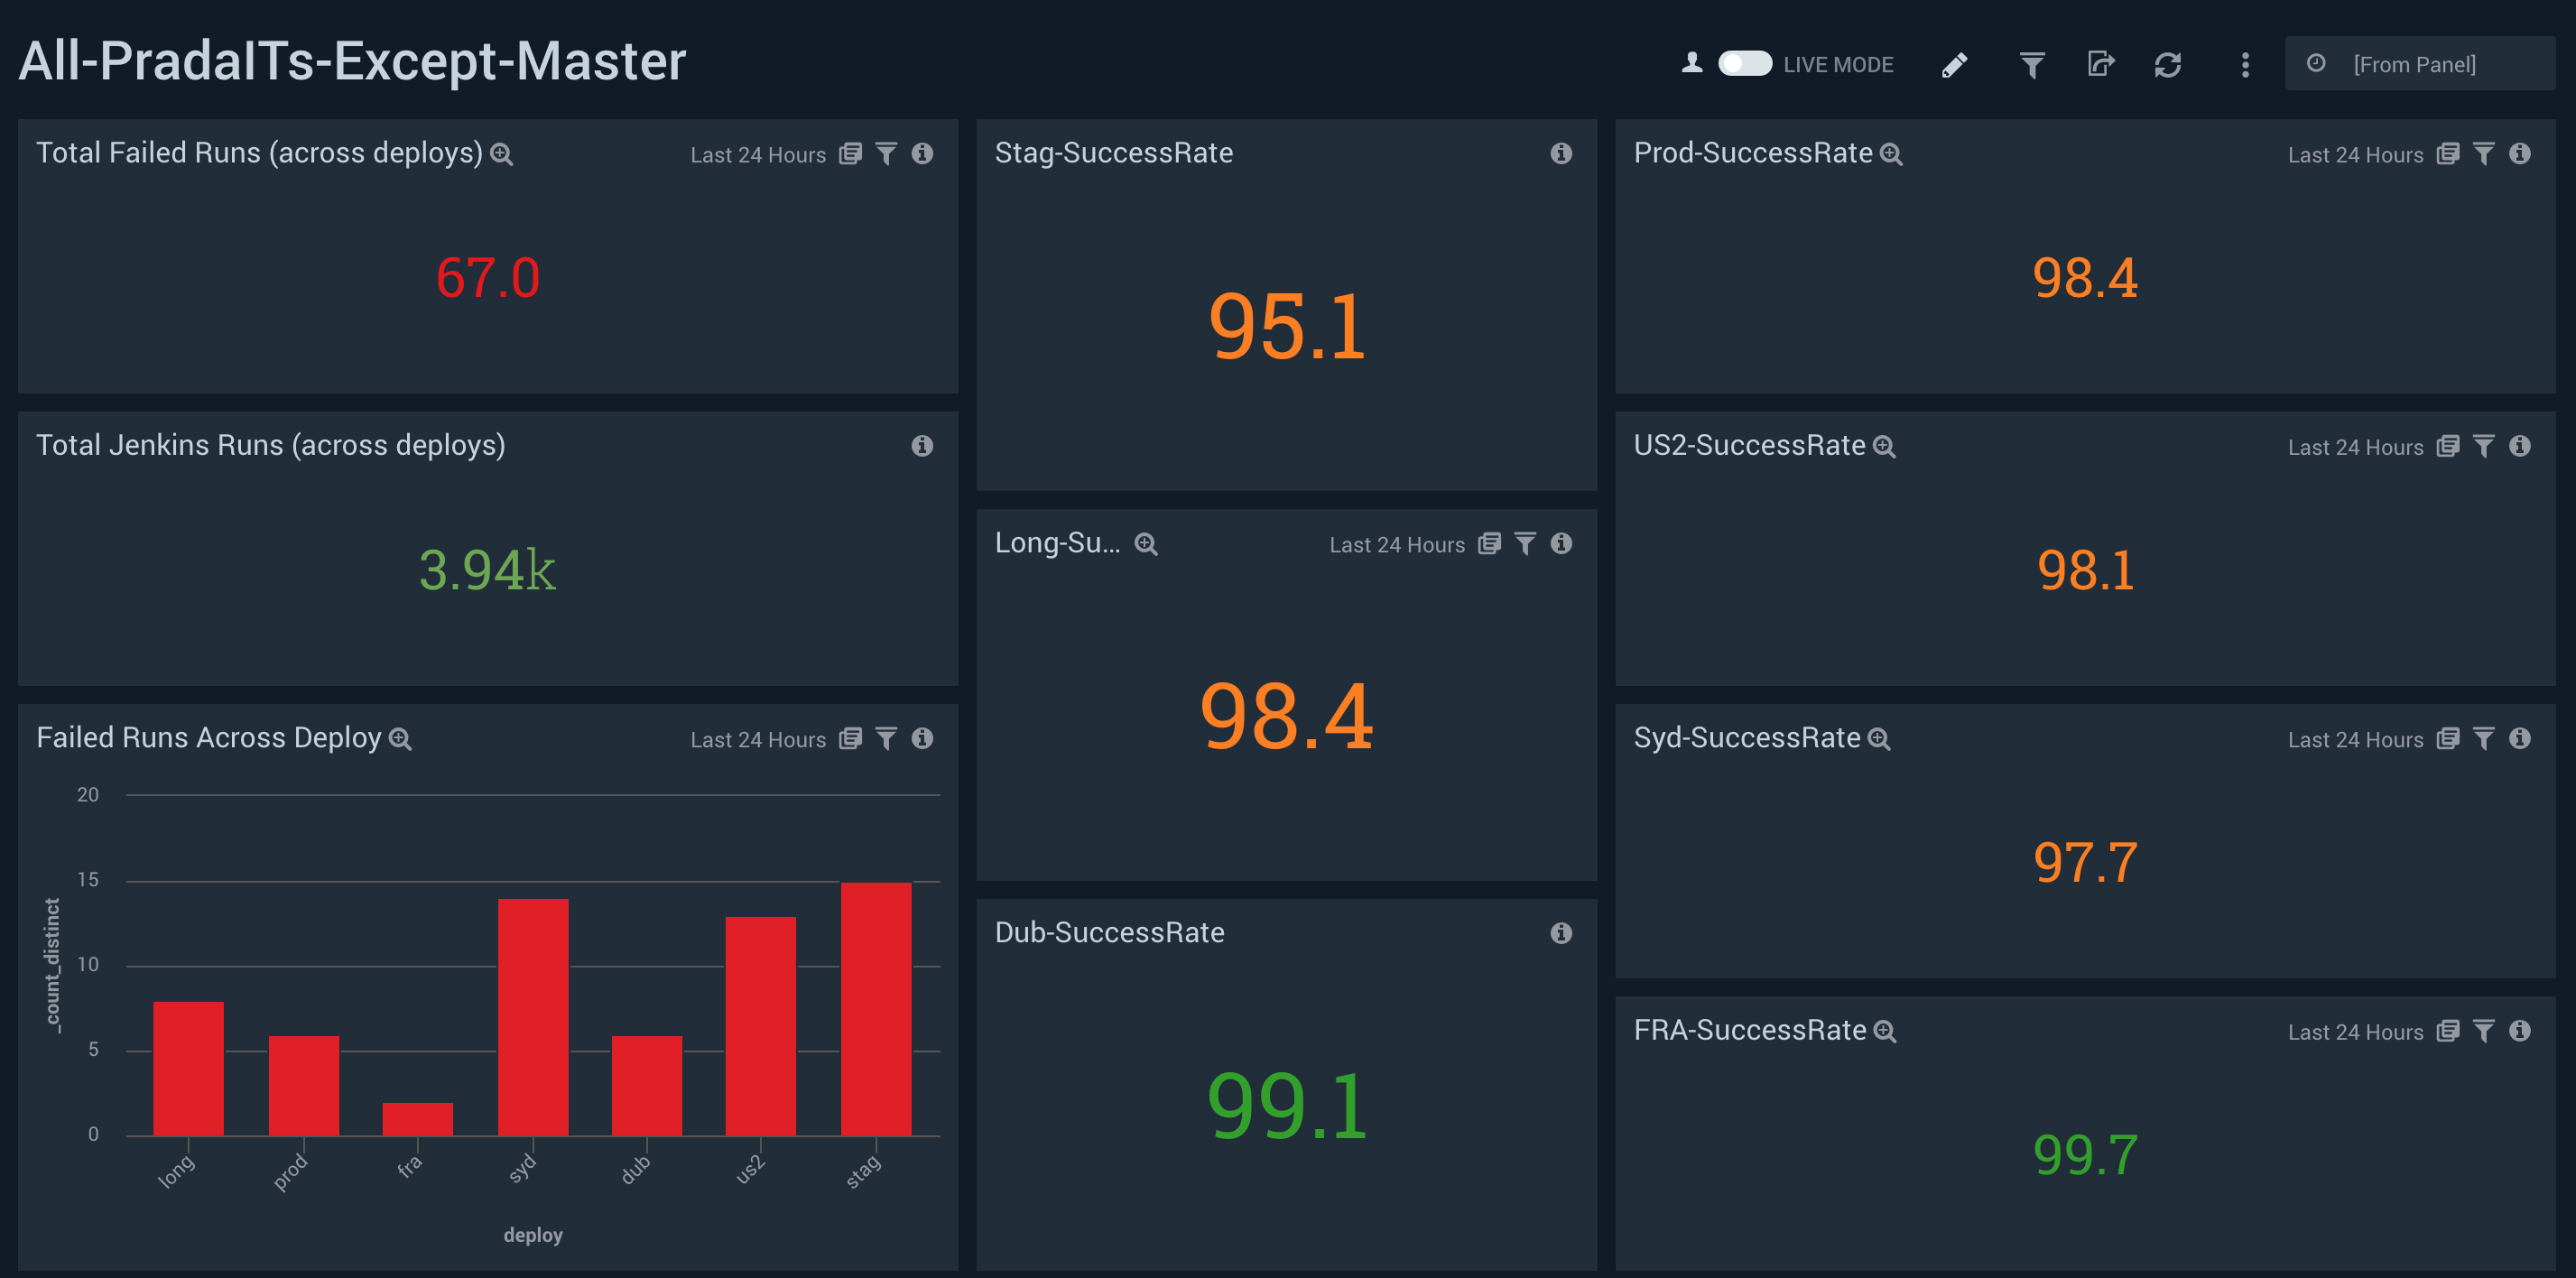
This one gives an overview of the success rate of different deploys.
Big Takeaway
Adopting a microservices architecture is one of the best ways to scale your systems in a way that optimizes your talent, helps the business grow and better serves customers. In order to do that, your teams must rely heavily on automation.
With this increased dependency, analyzing every kind of failure is a must because it not only confirms the failure is in fact a real bug (and not the result of a testing issue), but also helps with faster delivery.
You can find more information on continuous delivery best practices here, or check out the Sumo Logic continuous delivery solutions page.
Not a Sumo Logic user yet? You can sign up for free here.
