No no no NOOOOO NOOOOOOOO… One could hear Mike almost yelling while staring at his computer screen.
Suddenly Mike lost the SSH connection to one of the core billing servers. He was in the middle of the manual backup before he could upgrade the system with the latest monkey patch.
Mike, gained a lot of visibility and the promotion, after his last initiative of migrating ELK Stack to SaaS-based machine data analytics platform, Sumo Logic. He improved MTTI/MTTR by 90% and uptime of the log analytics service by 70% in less than a month time.
With the promotion, he was in-charge of the newly formed site reliability engineering (SRE) team. He had 4 people reporting to him. It was a big deal. This was his first major project after the promotion and he wanted to ensure that everything goes well.
But just now, something happened to the billing server and Mike had a bad feeling about it.
He waited for few minutes to check if the billing server will start responding again. It has happened before, where SSH client used to temporarily lose the connection to the server. The root cause of the connection loss was the firewall in the corporate headquarters. They had to upgrade the firewall to fix this issue. Mike was convinced that it’s not the firewall, but something else has happened to the billing server, and this time around there was a way to confirm his hunch.
To view what happened to the billing server he runs a query on Sumo Logic.
“_SourceHost=billingserver AND “shut*”
He quickly realizes that server was rebooted. He broadens the search to +-5 minutes range from the above log message and identifies that disk was full.
He added some more disk to the existing server to ensure that billing server does not restart because of the lack of hard drive space.
However, Mike had no visibility into host metrics such as CPU, Hard Disk, and Memory usage. He needed a solution to gather host and custom metrics. He couldn’t believe how the application was managed without these metrics. He knew very well that Metrics must be captured to get visibility into system health. So he reprioritized his Metrics project over making ELK stack and entire infrastructure PCI compliant.
Stage 1: Installing Graphite
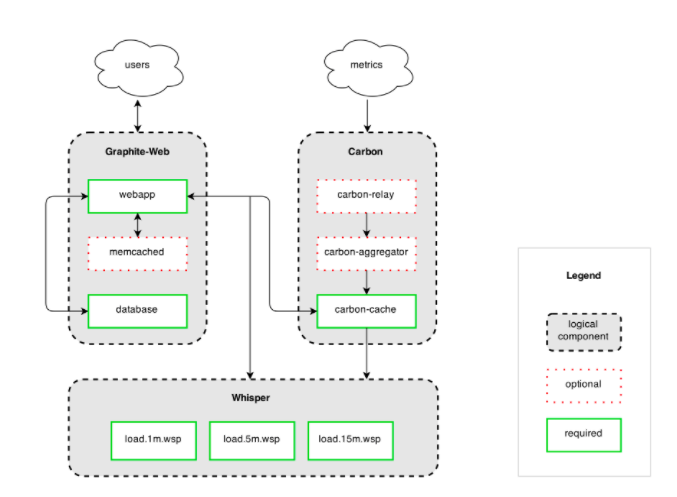
After a quick search, he identifies Graphite as one of his options. He had a bad taste in his mouth related to ELK, which cost him arm and a leg for just a search feature. This time though, he thought it will be different. Metrics were only 12 bytes in size! He thought how hard can it be to store 12 Bytes of data for 200 Machines? He chose Graphite as their open-source host metrics system. He downloads and installs the latest graphite on AWS t2.medium @ $0.016 USD per hour, Mike can get 4GB RAM with 2 vCPU. In less than $300 USD Mike is ready to test his new Metrics system. Graphite has three main components. Carbon, whisper and Graphite Web. Carbon listens on a TCP port and expects time series metrics. Whisper is a flat-file database while Graphite Web is a Django application that can query Carbon-cache and Whisper. He installs all of this on one single server. The logical architecture looks some like in Figure 1 below.
Summary: At the end of stage 1, Mike had a working solution with a couple of servers on AWS.
Stage 2: New Metrics stopped updating – the First issue with Graphite
On a busy day, suddenly new metrics were not shown in the UI. This was the first time ever after few months of operations that Graphite was facing issues.
After careful analysis, it was clear that metrics were getting written to the whisper files.
Mike, thought for a second and realized that whisper pre-allocates the disk space to whisper files based on the configuration in carbon.conf file. To make it more concrete, 31.1 MB is pre-allocated by whisper for 1 metric collected every 1 second for one host and retained for 30 days. Total Metric Storage = 1 Host* 1 metric/sec* 60 sec *60 mins *24 hrs *30 days retention.
He realized that he might have run out of disk space and sure enough, that was the case. He doubled the disk space, restarted the graphite server and now new data points started showing up. Mike was happy that he was able to resolve the issue before it got escalated. However, his mind started creating “What-If” scenarios. What if the application he is monitoring goes down exactly at the same time Graphite gives up?
He parks that scenario in the back of his head and goes back to working on other priorities.
Summary: At the end of stage 2, Mike already had incurred additional storage cost and ended up buying EBS Provisioned IoPS volume. SSD would have been better but this is the best he could do with the allocated budget.
Stage 3: And Again New Metrics Stopped Updating
On Saturday night 10 PM there was a marketing promotion. Suddenly it went viral and a lot of users logged into the application. Engineering had auto-scaling enabled on its front end while Mike had ensured that new images will automatically enable StatsD.
Suddenly the metrics data points per minute (DPM) grew significantly and way above average DPM.
Mike, had no idea about these series of events. The ticket with only information he received was “New Metrics are not showing up, AGAIN!”
He quickly found out the following.
MAX_UPDATES_PER_SECOND which determines how many updates you must have per second was increasing gradually also MAX_CREATES_PER_MINUTE was at its max.
Mike quickly realized the underlying problem.
It was the I/O problem causing the server to crash because graphite server is running out of memory. Here is how he connects the dots.
Auto-scaling kicks in and suddenly 800 servers start sending the metrics to graphite. This is four times the load than the average number of hosts running at any given time. This quadruples the metrics ingested as well. Graphite configurations MAX_UPDATE_PER_SECOND and MAX_CREATES_PER_MINUTE reduces the load on disk I/O but it has an upstream impact. Suddenly carbon-cache starts using more and more memory. Considering “MAX_CACHE_SIZE” was set to infinite, Carbon-cache kept storing the metrics in the memory that was waiting to be written to whisper/disk.
As carbon-cache process ran out of memory it crashed and sure enough, metrics stopped getting updated. So Mike added EBS volume with provisioned I/O and upgraded the server to M3 Medium instead of t2.
Summary: At the end of stage 3, Mike has already performed two migrations. First, by changing the hard-drive he had to transfer the graphite data. Second, after changing the machine he had to reinstall and repopulate the data. Not to mention this time he has to reconfigure all the clients to send metrics to this new server.
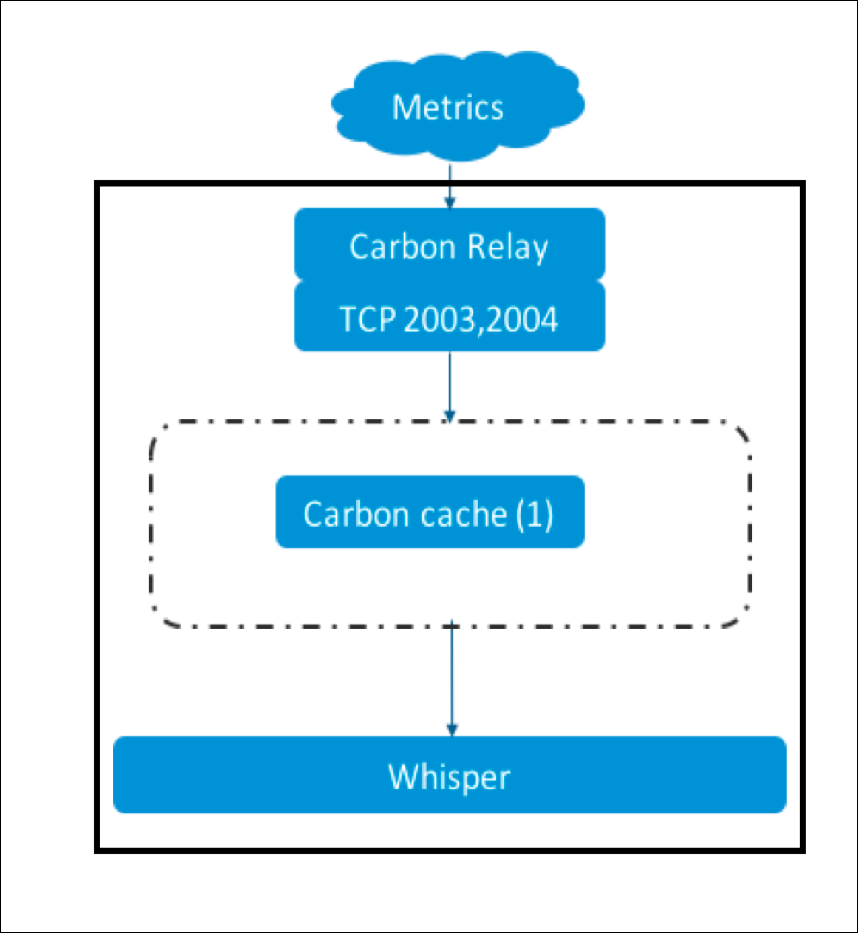
Figure 2: Single Graphite M3 Medium Server after Stage 3
Stage 4: Graphite gets resiliency, but at what cost?
Mike from his earlier ELK experience learned one thing, that he cannot have any single point of failures in his data ingest pipeline at the same time he has to solve for the Carbon relay crash. Before anything happens he has to resolve the single point of failure in the above architecture and allocate more memory to carbon-relay. He decided to replicate similar graphite deployment in a different availability zone. This time he turns on the replication in the configuration file and creates the architecture as below. The architecture below ensures replication and adds more memory to carbon-relay process so that it can hold metrics in memory while whisper is busy writing them to the disk.
Summary: At the end of stage 4, Mike has resiliency with replication and more memory for Carbon relay process. This change has doubled the Graphite cost from the last time.
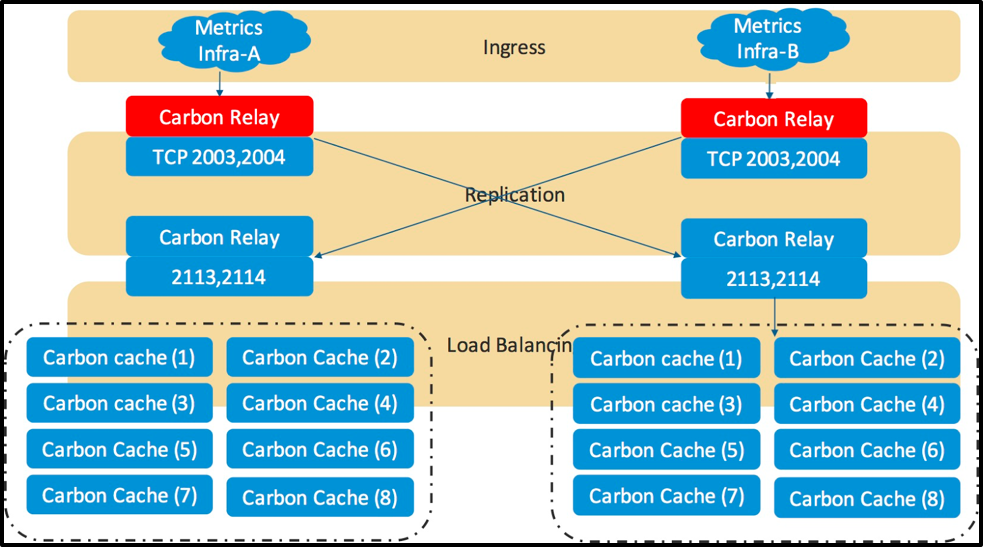
Figure 3: Two Graphite M3 Medium Server with replication after Stage 4
Stage 5: And another one bites the dust… Yet another Carbon Relay issue.
Mike was standing in the line for the hot breakfast. At this deli, one has to pay first and then get their breakfast. He saw a huge line at the cashier. The cashier seemed to be a new guy. He was slow and the line was getting longer and longer. It was morning and everyone wanted to quickly get back. Suddenly Mike’s brain started drawing an analogy. He thought carbon-relay as a cashier, person serving the breakfast as a carbon-cache and chef as a whisper. The chef takes the longest time because he has to cook the breakfast.
Suddenly he realizes the flaw in his earlier design. There is a line port (TCP 2003) and a Pickle port(TCP 2004) on Carbon-relay. Every host is configured to throw metrics at those ports. The moment Carbon-Relay gets saturated there is no way to scale them up without adding new servers and some network reconfigurations and hosts configuration changes. To avoid that kind of disruptions, he quickly comes up with a new design he calls it relay-sandwich.
He separates out HA proxy on its dedicated server. Carbon-relay also gets its own server so that it can scale horizontally without changing the configuration at the host level.
Summary: Each Graphite instance has four servers and total of 8 servers across two graphite instances. At this point, the system is resilient with headroom to scale carbon-relay.
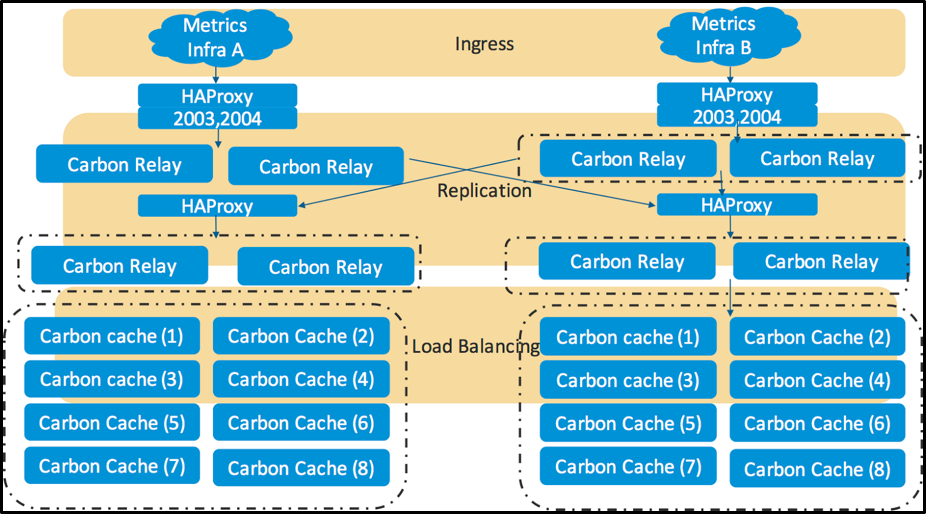
Figure 4: Adding more servers with HA Proxy and Carbon Relay
Stage 6: Where is my UI?
As you all must have noticed this is just the backend architecture. Mike was the only person running the show but if he wants more users to have access to this system, he must scale front end as well. He ends up installing Graphite-Web and the final architecture becomes as shown in figure 5.
Summary: Graphite evolved from single server to 10 machine Graphite cluster instance managing metrics only for the fraction of their infrastructure.
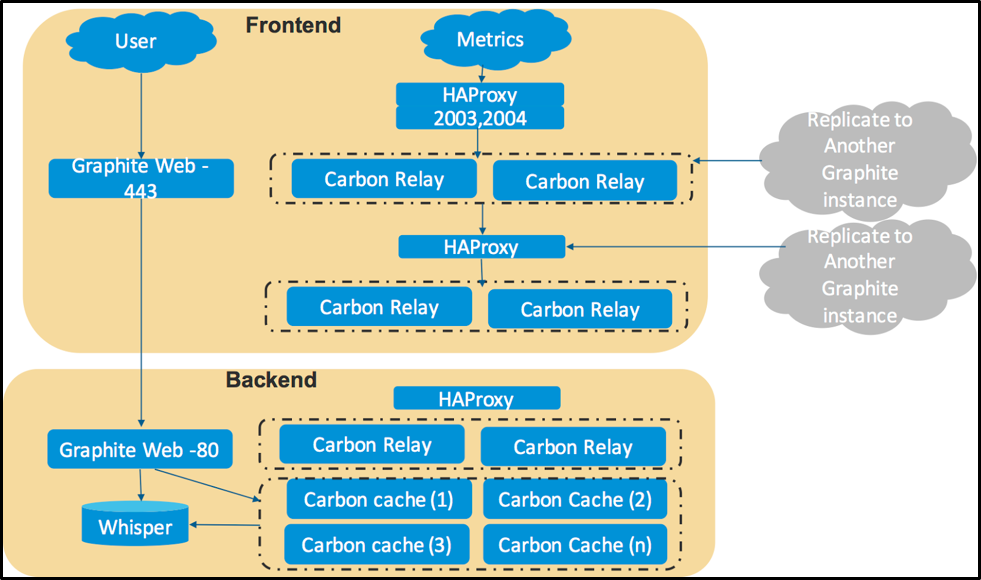
Figure 5: Adding more servers with HA Proxy and Carbon Relay
Conclusion:
It was Deja-vu for Mike. He had seen this movie before with ELK. After 20 servers in with Graphite, he was just getting started. He quickly realizes that if he enables custom metrics he has to double the size of his graphite cluster. Currently, the issue is graphite has metrics indicating “What” is wrong with the system while with Sumo Logic platform with correlated logs and metrics not only indicates “what” is wrong with the system but also indicates “why” something is wrong. Mike, turns on Sumo Logic metrics on the same collectors collecting logs and gets correlated logs and metrics on Sumo Logic platform. Best part he is not on the hook to manage the management system.
