It’s hard to understand the benefits of an Apache log analyzer without actually using one to explore your own logs. So, we’ve created a hands-on walkthrough of Sumo Logic’s Apache log analytics capabilities. If you’ve never used a dedicated log analyzer, this series will revolutionize your outlook on monitoring an Apache infrastructure.
Getting a Handle on Serious Errors
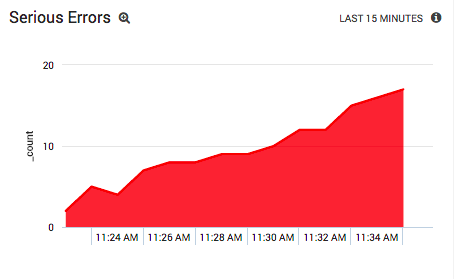
Some aspects of Apache log analytics involve optional optimizations, but gaining visibility into your servers’ critical errors is an absolute necessity. By providing a powerful query language and built-in visualizations, Sumo Logic provides instant insight into your Apache error logs.
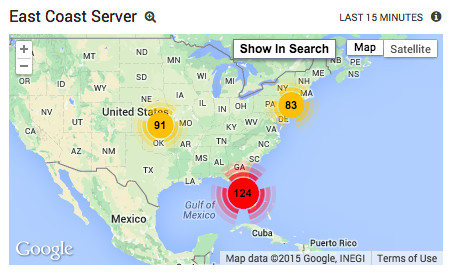
This lets you quickly filter log messages by their error level, identify trends in error reasons, determine if malicious client IPs are behind serious errors, and monitor important server events in real time.
Sifting through access logs to find 400- and 500-level errors is a pain for any system administrator. In the worst case, you’re directly grep’ing your access log file. In the best case, you’re piping your logs into a database so you can query it with SQL (but even that probably took a whole lot of finagling).
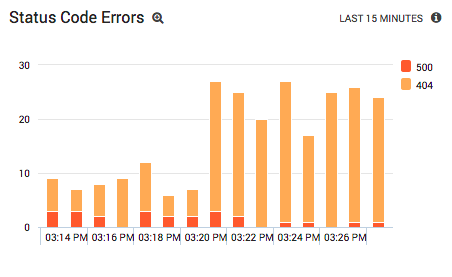
Either way, it’s almost impossible to identify real-time trends in status code errors without a way to aggregate and visualize results. Sumo Logic dashboards make it easy to monitor 404 errors, identify 404 URLs and referrers, and even set dynamic thresholds for what constitutes an “abnormal” amount of 500-level errors.
As a data structure, Apache logs are pretty simple. But, when you have a hundred servers generating millions of log messages, getting to the root cause of an issue is no trivial task. It’s not until you try aggregating logs from dozens of servers that you begin to see the true benefits of a dedicated log analysis tool.
Sumo Logic ensures an automated, reliable collection process and puts all of your logs in one place. This means you can query logs from hundreds or even thousands of servers in a single interface and find correlations across clusters. And, thanks to our multi-tenant cloud, operations on terabytes of log data are fast.
If you’re not asking these kinds of questions of your log data, you’re ignoring valuable insights. Apache log analytics doesn’t just reduce MTTR and increase uptime; it ensures your IT infrastructure is living up to its full potential.
Error monitoring is only one facet of Apache log analytics. There’s a whole other class of insights you can find in your log data, including optimizing web resources, identifying misbehaving bots, and speeding up Apache response times. Stay tuned for the second half of the Introduction to Apache Log Analytics.
It’s hard to understand the benefits of an Apache log analyzer without actually using one to explore your own logs. So, we’ve created a hands-on walkthrough of Sumo Logic’s Apache log analytics capabilities. If you’ve never used a dedicated log analyzer, this series will revolutionize your outlook on monitoring an Apache infrastructure.
Getting a Handle on Serious Errors
Some aspects of Apache log analytics involve optional optimizations, but gaining visibility into your servers’ critical errors is an absolute necessity. By providing a powerful query language and built-in visualizations, Sumo Logic provides instant insight into your Apache error logs.
This lets you quickly filter log messages by their error level, identify trends in error reasons, determine if malicious client IPs are behind serious errors, and monitor important server events in real time.
Sifting through access logs to find 400- and 500-level errors is a pain for any system administrator. In the worst case, you’re directly grep’ing your access log file. In the best case, you’re piping your logs into a database so you can query it with SQL (but even that probably took a whole lot of finagling).
Either way, it’s almost impossible to identify real-time trends in status code errors without a way to aggregate and visualize results. Sumo Logic dashboards make it easy to monitor 404 errors, identify 404 URLs and referrers, and even set dynamic thresholds for what constitutes an “abnormal” amount of 500-level errors.
As a data structure, Apache logs are pretty simple. But, when you have a hundred servers generating millions of log messages, getting to the root cause of an issue is no trivial task. It’s not until you try aggregating logs from dozens of servers that you begin to see the true benefits of a dedicated log analysis tool.
Sumo Logic ensures an automated, reliable collection process and puts all of your logs in one place. This means you can query logs from hundreds or even thousands of servers in a single interface and find correlations across clusters. And, thanks to our multi-tenant cloud, operations on terabytes of log data are fast.
If you’re not asking these kinds of questions of your log data, you’re ignoring valuable insights. Apache log analytics doesn’t just reduce MTTR and increase uptime; it ensures your IT infrastructure is living up to its full potential.
Error monitoring is only one facet of Apache log analytics. There’s a whole other class of insights you can find in your log data, including optimizing web resources, identifying misbehaving bots, and speeding up Apache response times. Stay tuned for the second half of the Introduction to Apache Log Analytics.
Complete visibility for DevSecOps
Reduce downtime and move from reactive to proactive monitoring.