When it comes to IT operations, there are two main categories of Apache log analytics: error monitoring and server optimization. In the first part of this series, we discussed the former. In this article, we’ll introduce several types of Apache server optimization.
As in Part I, all of these articles provide a hands-on walkthrough of Sumo Logic’s Apache log analytics capabilities. You should walk away with the confidence to identify server configuration issues or malicious clients in your own Apache log data.
Understand Your Apache Traffic
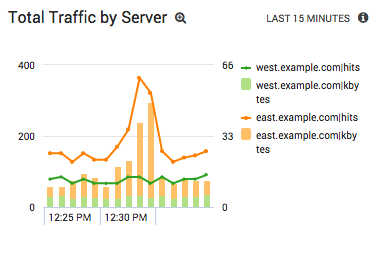
The first step towards gaining actionable insights into your Apache server operations is to examine basic traffic metrics like the number of requests and the total bytes served. Sumo Logic includes many built-in dashboards to monitor these metrics in real time.
Pivoting hits and traffic volume against other fields in your Apache logs helps you find all sorts of web optimization opportunities. For example, the above chart tells you that only one of your servers experienced a traffic spike. After you know which server to look at, you might continue your analysis by examining hits against URL or referrer to identify potential caching issues or hotlinked content, respectively.
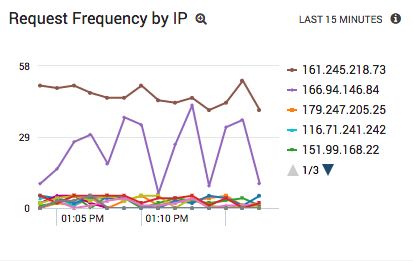
Compared to grep’ing your log files, identifying suspicious traffic with an Apache log analyzer is a breeze. A powerful query language lets you search for all sorts of client behavior in your Apache logs, and visualizations provide an at-a-glance view of potential bots.
In addition to examining traffic from known bots like Googlebot, Sumo Logic also provides several queries designed to help you identify unknown bots. For example, the above chart identifies two suspicious IP addresses by analyzing the request frequency of every client in your Apache logs.
By quickly identifying misbehaving bots, scraping behavior, and potential DoS attacks, Sumo Logic makes sure your Apache infrastructure is serving your customers as efficiently as possible.
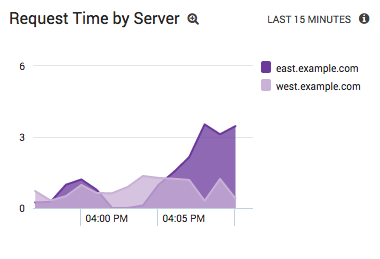
Both traffic and robot analysis are concerned with improving the performance of your web applications. Apache lets you record response times in a custom access log format, which gives you much more visibility into your system performance. For example, the following area chart clearly indicates that one of your servers is overloaded.
Comparing response time to traffic volume, URL, and server quickly identifies the root cause of any performance issues. And, the faster you can catch performance issues, the less impact they’ll have on your users.
Analyzing robots, traffic, and response times aren’t typically as mission-critical as the topics we discussed in the first part of this series. Fixing performance bottlenecks can, however, provide a much better user experience.
The goal of Apache log analytics is to be able to say “I know what’s wrong and we’re already fixing it” whenever your customers call you up about a problem with your website. Instead of SSH’ing into all your servers and inspecting individual log files, all you have to do is glance at your dashboards to figure out where you should start your debugging.
We hope that these hands-on walkthroughs have provided a glimpse into the potential insights you can glean from your own Apache log data.
When it comes to IT operations, there are two main categories of Apache log analytics: error monitoring and server optimization. In the first part of this series, we discussed the former. In this article, we’ll introduce several types of Apache server optimization.
As in Part I, all of these articles provide a hands-on walkthrough of Sumo Logic’s Apache log analytics capabilities. You should walk away with the confidence to identify server configuration issues or malicious clients in your own Apache log data.
Understand Your Apache Traffic
The first step towards gaining actionable insights into your Apache server operations is to examine basic traffic metrics like the number of requests and the total bytes served. Sumo Logic includes many built-in dashboards to monitor these metrics in real time.
Pivoting hits and traffic volume against other fields in your Apache logs helps you find all sorts of web optimization opportunities. For example, the above chart tells you that only one of your servers experienced a traffic spike. After you know which server to look at, you might continue your analysis by examining hits against URL or referrer to identify potential caching issues or hotlinked content, respectively.
Compared to grep’ing your log files, identifying suspicious traffic with an Apache log analyzer is a breeze. A powerful query language lets you search for all sorts of client behavior in your Apache logs, and visualizations provide an at-a-glance view of potential bots.
In addition to examining traffic from known bots like Googlebot, Sumo Logic also provides several queries designed to help you identify unknown bots. For example, the above chart identifies two suspicious IP addresses by analyzing the request frequency of every client in your Apache logs.
By quickly identifying misbehaving bots, scraping behavior, and potential DoS attacks, Sumo Logic makes sure your Apache infrastructure is serving your customers as efficiently as possible.
Both traffic and robot analysis are concerned with improving the performance of your web applications. Apache lets you record response times in a custom access log format, which gives you much more visibility into your system performance. For example, the following area chart clearly indicates that one of your servers is overloaded.
Comparing response time to traffic volume, URL, and server quickly identifies the root cause of any performance issues. And, the faster you can catch performance issues, the less impact they’ll have on your users.
Analyzing robots, traffic, and response times aren’t typically as mission-critical as the topics we discussed in the first part of this series. Fixing performance bottlenecks can, however, provide a much better user experience.
The goal of Apache log analytics is to be able to say “I know what’s wrong and we’re already fixing it” whenever your customers call you up about a problem with your website. Instead of SSH’ing into all your servers and inspecting individual log files, all you have to do is glance at your dashboards to figure out where you should start your debugging.
We hope that these hands-on walkthroughs have provided a glimpse into the potential insights you can glean from your own Apache log data.
Complete visibility for DevSecOps
Reduce downtime and move from reactive to proactive monitoring.