Early on, we measured data volume in gigabytes. Then we moved onto terabytes. Now, it’s petabytes. But the scale of data is not the only thing that has changed. We now deal with different types of data as well. In particular, the introduction of large volumes of machine data have created new opportunities for machine data analytics.
Leveraging machine data, especially logs and metrics, is a key part of advancing the DevOps workflow. Advanced analytics based on machine data allows DevOps engineers to make sense of petabytes of data by using statistical, indexing, filtering and machine learning techniques.
In this post, I explain how to use Sumo Logic’s cloud-native platform to analyze large volumes of machine data to drive actionable insights.
Using Sumo Logic Unified Logs and Metrics for Machine Data
Let’s start by discussing how Sumo Logic allows users to visualize machine logs and metrics.
Sumo makes this information available through a single, unified interface—the Sumo Logic Application Status Dashboard. The dashboard shows the DevOps engineer a real-time visualization of the status quo regarding logs and metrics.
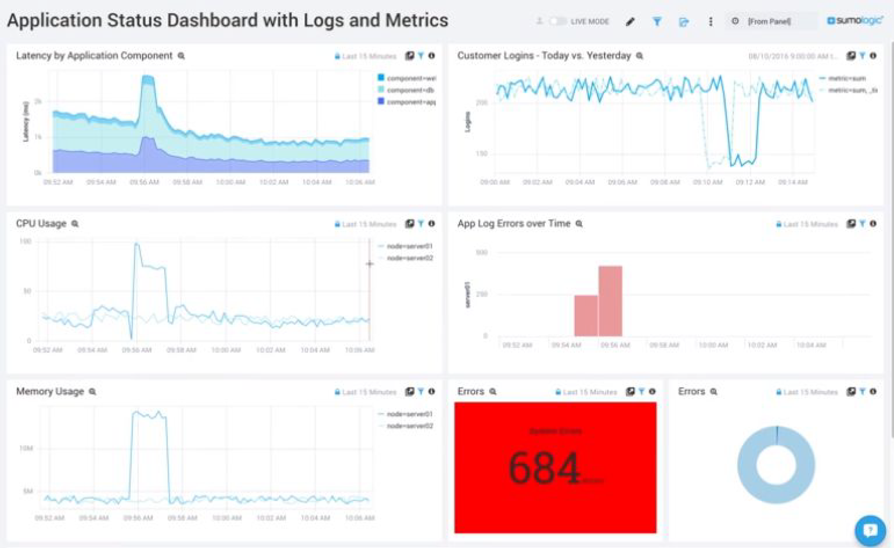
The Sumo Logic Application Status Dashboard
The image above shows the available metrics in this example: latency, customer logins, CPU usage, app log errors, and memory usage and errors. Additional metrics can be visualized in the dashboard as well, depending on which type of data is available. Examples of supported logs include error logs, binary logs, general and slow query logs, and DDL logs.
In addition, since the dashboard is connected to those logs, it allows you to drill down to find more details about an issue.
The Sumo Logic Dashboard and DevOps
Using the available logs and metrics, a DevOps engineer can perform a quick root cause analysis on a production issue so the problem can be addressed quickly. That’s essential in DevOps because quick resolution of problems assures that pipelines can keep flowing continuously.
This video demonstrates the Sumo Logic Application Dashboard in action:
Notice in particular the use of filtering—one of the analytics techniques Sumo Logic uses to help a DevOps engineer tackle an issue.
Other analytics methods include statistical, indexing and machine learning techniques.
Machine Data, Predictive Analytics and Sumo Logic
Sumo Logic lets you do more with machine data than simply find out what happened. You can also use it as a predictive analytics platform to identify trends and understand what is likely to happen next with your infrastructure or DevOps development pipeline.
Predictive analytics based on machine data are valuable because the vast volume of data coming daily into an organization means that a large amount of that data turns into noise and ultimately masks the messages that are most important. With predictive analytics, DevOps teams can make the most of all data, even if they can’t react to it all in real time.
Consider, for example, the case of a CPU usage spike or a memory drop. Predictive analytics techniques could help you to predict when such events will occur again so that you can prepare for them.
Similarly, predictive analytics delivered via tools like Sumo Logic can help you to find patterns in a vast amount of data without having to program your own code. Sumo can identify the trends and help you make sense of them through a convenient interface.
That’s a big help to DevOps professionals because it means that, using Sumo Logic, they can make sense of a large volume of information without having to be experts in statistics or data analytics programming. Instead, they can focus on what they know best—whether it is coding, testing or system administration—and rely on Sumo Logic to be the data analytics expert on their team.
LogReduce: Clean Up Your Machine Data
A final feature worth mentioning is LogReduce. This is a feature in Sumo Logic that, like unified logs and metrics, helps DevOps engineers to reduce the noise in their machine data.
The following video shows an example of LogReduce:
As you can see, a lot of calculations and analysis are done under the hood. All the DevOps engineer had to do was push the LogReduce button.
This saves the DevOps engineer from having to worry about machine learning techniques, freeing him or her to focus on the problem to be solved.
In my opinion, every DevOps engineer using the LogReduce button should have at least a basic understanding of machine data. Otherwise, results could be misinterpreted. Still, LogReduce is a great feature for transforming a baseline knowledge of machine data analytics into expert-level results.
About the Author
Cordny Nederkoorn is a software test engineer with over 10 years of experience in finance, e-commerce and web development.
He is also the founder of TestingSaaS, an international community researching cloud applications with a focus on forensics, software testing and security.
