You’ve probably heard about logs and metrics and have been told you need to monitor them. You may be told to monitor them for compliance or because someone suggested it’d be a great way to reduce time to investigate bugs. It can be a ton to handle and understand, and there’s a great deal of information out there.
Securely Migrate to the Cloud
Cloud computing is quickly becoming the standard for modern applications and enterprises. Learn how to securely migrate to the cloud today!
Brief History of Modern IT

Information systems are ever-evolving. They evolve rapidly in the types of hardware and software that’s used. Systems evolve in how they all come together in a system through their architecture. These systems have been around for generations in various ways, even in the pre-computer era. Though it may be fun to research how logging worked with a Babbage Difference Engine, it may not be the most relevant topic here. To make this relevant to logs and metrics, let’s look at just the past two decades and focus on web systems.
We all know how IT systems looked even up to the mid-2000s. They were relatively simple compared to today. There was usually a centralized server, some networking devices connecting them all together, and some controller managing access. Web IT systems were generally composed of a centralized web server that hosted static pages with some dynamic content queried from databases. Of course, there’s a bit more complexity to it all, but it was typically far less complex architecturally than today.
If there were errors occurring or reliability issues, we’d look into the logs of a couple servers. For the most part, the architecture was manageable enough that we could manually look at logs.
Simple.
The Cloud
As web technology advanced, websites started evolving from static with a little bit of dynamically generated content to robust applications where the browser was really just a terminal to interact with the applications. This presented a problem of scalability on the backend where customers needed access to their systems in near real time with little or no delay. Service-oriented architectures (SOA) started taking off and gave birth to the “cloud” as we know it: on-demand scalability. Amazon Web Services (AWS) propelled this technology to the mainstream and proliferated the concepts worldwide with the release of Elastic Compute Cloud (EC2) in 2006.
To achieve the scalability to meet the demand, new architectures of information systems emerged. No longer do you manually have to physically create servers to support loads or throw more RAM into a physical box. There’s no need to really manage the virtualization software. The cloud platforms allow you to just click a few buttons, and you can have a high performance server in minutes. Different services’ load balancers and autoscaling now takes care of this all automatically as needed.
Now we have an infrastructure of potentially unknown amount of systems all working in unison. Architectures that deploy microservices through the use of a container service like Docker add even more complexity. This poses a major issue for troubleshooting when a problem arises.
Bottlenecks in Troubleshooting
Let’s suppose during a peak usage time, customers are seeing error statuses as the page loads. At the same time, you’re seeing there’s still plenty of healthy activity. To find the errors, you would look to your logs. When there are 100s if not 1000s of instances and containers, it can be virtually impossible to track down even the instance that’s having the problem let alone the individual event that is causing those errors.

This is generally where we are today.
Today’s architectures are incredibly complex and are made up of an endless number of components. The fun part is that all these components in the systems can be put together by a tiny team. The same level of physical architecture needed years ago would have been laughably impossible with those resources. The not-so-fun part is that managing, orchestrating, and monitoring it all cannot be done “the easy way” anymore by just opening a log file and grepping it.
Manually reviewing the individual logs of all the components simply doesn’t scale. To help out with investigations and troubleshooting, many log management tools have been developed to centrally collect logs and analyze large amounts of data in realtime.
Logs vs Metrics
Before we continue on, it may be a good idea to understand the difference between logs and metrics.
What Are Logs?
A log message is a system generated set of data when an event has happened to describe the event. In a log message is the log data. Log data are the details about the event such as a resource that was accessed, who accessed it, and the time. Each event in a system is going to have different sets of data in the message.
If you want to read deep into the topic, check out Logging and Log Management (Chuvakin et al, 2013). They specify five different general categories of logs: informational, debug, warning, error, or alert.
Informational are typically “benign” events; debug are used during troubleshooting code or systems; warning are things like something may be missing but won’t directly impact the system; error are messages to convey a problem has occurred; and alert are that something important has happened and are largely around security use cases.
In essence, logs will tell the “story” for what happened in a system that got it to the issue you’re troubleshooting.
To learn more about how to create a log message, I have a previous blog post around what goes into it: Best Practices for Creating Custom Logs.
What Are Metrics?
While logs are about a specific event, metrics are a measurement at a point in time for the system. This unit of measure can have the value, timestamp, and identifier of what that value applies to (like a source or a tag). Logs may be collected any time an event takes place, but metrics are typically collected at fixed-time intervals. These are referred to as the resolution.
The collection of the data is referred to as a time-series metric. They can be visualized in different types of graphs such as gauges, counters, and timers.
The topic of metrics is still relatively new in the industry, and I highly recommend reading James Turnbull’s The Art of Monitoring.
Though a measurement of the health of the system can be stored in a performance log file, this method can be very costly to collect the health of the system. You’re basically creating a new entry constantly with all the metadata about the system to get a single number. A metric will normalize this so you aren’t logging the same data over and over. You’re only storing the number and timestamp. The metric will be a tiny fraction of the size of an entire log entry for these measurements.
Do I Really Need Both Logs and Metrics?

A log is an event that happened and a metric is a measurement of the health of a system.
Think of it this way. If you go to a doctor when you’re sick, you can tell her everywhere you went in the past week. You can mention things like you were at a food festival, your kid’s birthday party, and your office. If you give your doctor enough clues about your history, she may possibly be able to pinpoint your ailment exactly.
This would be the same as troubleshooting your system based completely on looking at logs.
To help her with coming up with a very confident conclusion about what is wrong and how to get better, she’ll need your vitals like blood pressure, temperature, weight, and possibly other measurements like blood samples. You will always have these measurements that can be taken whether you’re healthy or sick. These are the equivalent of the metrics.
If you theoretically have a constant flow of these measurements for long periods of time, she can see your temperature starting to rise at a certain time outside of your normal range. She can see from your history of where you were that you were at the food festival a day before. She can conclude that a food you ate at the festival got you sick, a day later your temperature started to rise slightly without you noticing, and a day after that you started feeling your symptoms. She’ll know with confidence the ailment based on that pattern of symptoms in relation to what you remember doing.
Ok, so this is an overly simplified approach to medicine. I have no medical expertise to say that my anecdote is realistic. But it’s a good analogy to grasp the difference between logs and metrics and how they can work together.
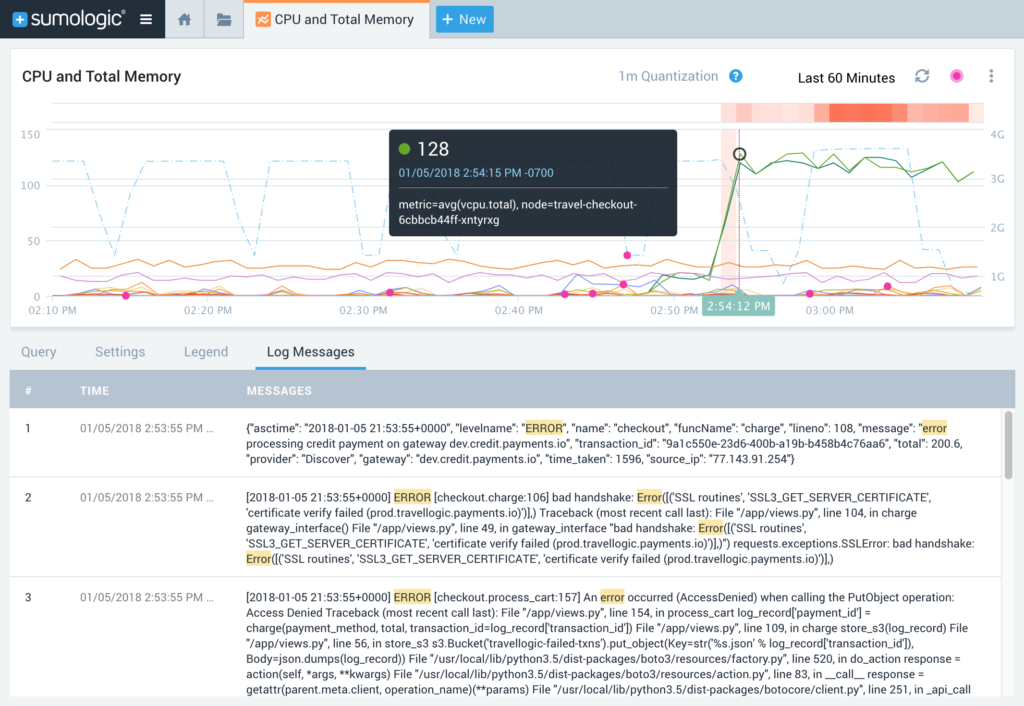
Let’s relate this analogy to IT management. If you were to start having significant errors on your server, you can look back at your logs. The problem may be that there’s an acceptable error rate and you don’t know exactly when the real issue started in all the noise. It can take some time to really dig in and find the starting point of the actual issue.
With your metrics history, memory usage is fairly stable and consistent. You then spot a sudden rise and spike in the memory utilization. But without the logs, it doesn’t mean much besides telling you, “uhh this isn’t right…”
Bringing together both logs and metrics can provide much more clarity. During the spike in memory utilization, there may be some unusual log entries indicating the specific event that took place that caused the spike.
How to Get Started with Logs and Metrics
Whichever service(s) you want to handle your collection of data, it’s all going to come down to your use case and what you want to understand. If you’re a DevOps engineer keeping your systems up and stable, then maybe audit logs for your GSuite probably won’t be the most relevant. On the other hand, if you’re a security engineer keeping the bad guys out, then stack traces from the dev environment may not exactly tell you that you have someone snooping around your AWS environment. As a developer, you probably do care about those stack traces.
Security
Do you not have visibility into who’s accessing your AWS environment? You should be monitoring at least your CloudTrail, VPC, and ELB logs. Host Metrics of your instances can tell you potentially that your CPU and network utilizations are suddenly under a heavy load, which can be indicative of an attack. Getting an alert of this spike will have you jump into your tool at the exact time the spike started. Then you can correlate your events to this start to understand potentially why it began.
DevOps
Do you want to debug your code and troubleshoot an outage? Sending debug logs, stack traces, and commits would help, but also make sure you’re bringing in your production logs to see how it runs once it’s under a real load. Again, host metrics or CloudWatch Metrics can easily tell you down to the second when your system suddenly began raising in resource utilization. You can potentially use this exact second to easily see you also had a commit seconds before which broke a service and brought down other services.
So the type of event logs you’ll want to collect is going to have an answer of: it depends.
Plan and Architect
There are many use case and scenarios for what you want to know about your system. There is no one right answer many times. Good ol’ requirements gathering, project management, and architecting are important to make sure you are bringing in the right data to solve your problem. There will be use cases where you only need logs. There’s times where you’ll only need metrics. Then there’s ones where bringing them together will make your job easier than you thought possible.
I’ve worked with customers who have the dreaded compliance use case. No one wants to spend money on storing logs for regulatory reasons. Yet if they’re already sending that data over, they may as well see what other intelligence they can gather from it. It is not uncommon for a customer to get that “whoa!” moment and realize there’s a goldmine of information waiting to make their lives easier from the required compliance logs alone.
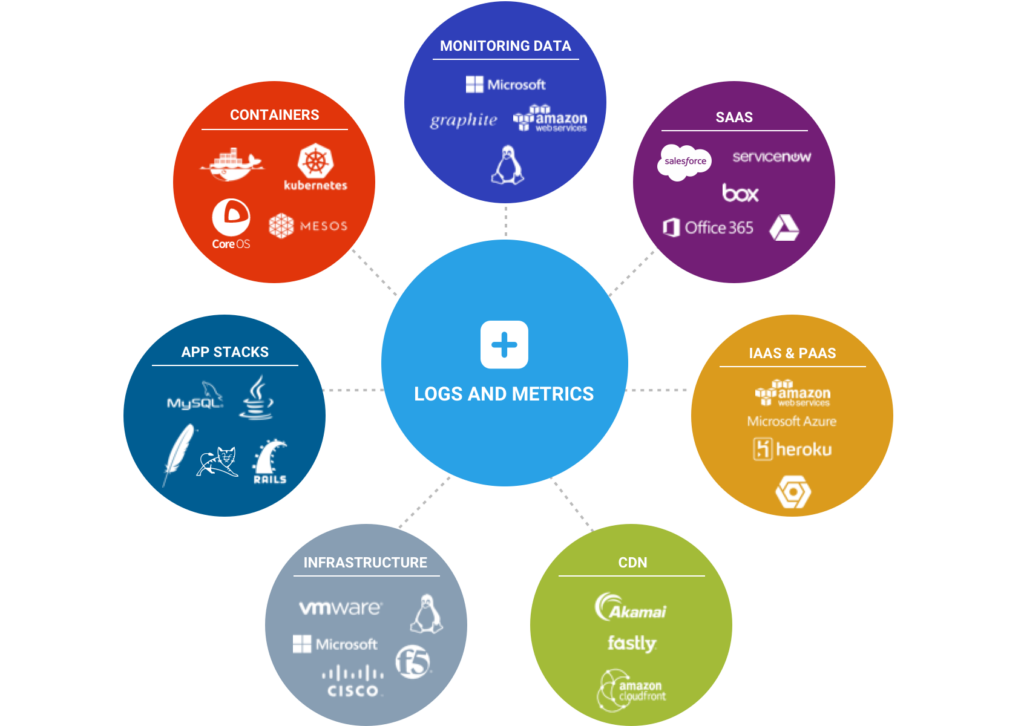
There are many logging and metrics tools out there. There’s still few outside of Sumo Logic that allows you to ingest both logs and metrics then correlate them together natively. Often times, they handle logs or metrics and have integrations for the other type of data. We feel the two are too important to be independent of each other. They need to work together to tell you the whole story of your systems.
Complete Visibility for DevSecOps
Reduce downtime and move from reactive to proactive monitoring.
