Memory leaks happen when programs allocate more memory than they return. Memory is beside Compute one of the critical assets of any computer system. If a machine runs out of memory, it cannot provide its service. In the worst case, the entire machine might crash and tear down all running programs.
The bugs responsible for that misbehavior are often hard to find. Sumo’s collector enables monitoring memory consumption out of the box. Using some additional tooling, it is possible to collect fine-grained logs and metrics that accelerate finding and efficient debugging of memory leaks.
Memory Management and Memory Leaks
Memory management is done on multiple levels: The Operating System (OS) keeps track of memory allocated by its program in kernel space. In user space, virtual machines like the JVM might implement their own memory management component. At its core, memory management follows a Producer-Consumer pattern. The OS or VM gives away (produces) chunks of memory whenever programs are requesting (consuming) memory. Since memory is a finite resource in any computer system, programs have to release the allocated memory that is then returned to the pool of available memory managed by the producer. For some applications, the programmer is responsible for releasing memory, in others like the JVM a thread called garbage collector will collect all objects that are used no more. A healthy system would run through this give-and-take in a perfect circle.
In a bad system, the program fails to return unused memory. This happens for example if the programmer forgets to call the functionfree, or if some objects keep on being referenced from a global scope after usage. In that case, new operations will allocate more memory on top of the already allocated, but unused memory. This is misbehavior is called a memory leak. Depending on the size of the objects this can be as little as a few bytes, kilobytes, or even megabytes if the objects, for example, contain images. Based on the frequency the erroneous allocation is called, the free space fills up as quickly as a few microseconds or it could take months to exhaust the memory in a server. This long time-to-failure can make memory leaks very tricky to debug because it is hard to track an application running over a long period. Moreover, if the leak is just a few bytes this marginal amount gets lost in the noise of common allocation and release operations. The usual observation period might be too short to recognize a trend.
This article describes a particularly interesting instance of a memory leak. This example uses the Akka actor framework, but for simplicity, you can think of an actor as an object. The specific operation in this example is downloading a file:
- An actor is instantiated when the user invokes a specific operation (download a file)
- The actor accumulates memory over its lifetime (keeps adding to the temporary file in memory)
- After the operation completes (file has been saved to disk), the actor is not released
The root cause of the memory leak is that it can handle only one request and it is useless after saving the content of the file. There are no references to the actor in the application code, but there still is a parent-child relationship defined in the actor system that defines a global scope.
From After-the-Fact Analysis to Online Memory Supervision
Usually, when a program runs out of memory it terminates with an “Out of Memory” error or exception. In case of the JVM, it will create a heap dump on termination. A heap dump is an image of program’s memory at the termination instant and saved to disk. This heap dump file can then be analyzed using tools such as MemoryAnalyzer, YourKit, or VisualVM for the JVM. These tools are very helpful to identify which objects are consuming what memory. They operate, however, on a snapshot of the memory and cannot keep track of the evolution of the memory consumption. Verifying that a patch works is out of the scope of these tools.
With a little scripting, we can remediate this and use Sumo to build an “Online Memory Supervisor” that stores and processes this information for us. In addition to keeping track of the memory consumption history of our application, it saves us from juggling around with heap dump files that can potentially become very large. Here’s how we do it:
1. Mechanism to interrogate JVM for current objects and their size
The JVM provides an API for creating actual memory dumps during runtime, or just retrieve a histogram of all current objects and their approximate size in memory. We want to do the latter as this is much more lightweight. The jmap tool in the Java SDK makes this interface accessible from the command line:
jmap -histo PID
Getting the PID of the JVM is as easy as grepping for it in the process table. Note that in case the JVM runs as a server using an unprivileged user, we need to run the command as this user via su. A bash one-liner to dump the object histogram could look like:
sudo su stream -c"jmap -histops -ax | grep "[0-9]* java" | awk '{print $1}' > /tmp/${HOSTID}_jmap-histo-`date +%s`.txt"
2. Turn result into metrics for Sumo or just drop it as logs
As a result of the previous operation, we have now a file containing a table with object names, count, and retained memory. IN order to use it in Sumo we’ll need to submit it for ingestion. Here we got two options: (a) send the raw file as logs, or (b) convert the counts to metrics. Each object’s measurement is a part of a time series tracking the evolution of the object’s memory consumption. Sumo Metrics ingest various time series input formats, we’ll use Graphite because it’s simple. To affect the conversion of a jmap histogram to Graphite we use bash scripting. The script cuts beginning and end of the file and then parses the histogram to produce two measurements:
<class name, object count, timestamp>
<class name, retained size, timestamp>
Sending these measurements to Sumo can be done either through Sumo’s collector, using collectd with Sumo plugin, or sending directly to the HTTP endpoint. For simplicity, we’ve used the Graphite format and target the Sumo collector. To be able to differentiate both measurements as well as different hosts we prepend this information to the classpath:
<count|size>.<host>.classpath
For example, a jmap histogram might contain data in tabular form like:
69: 18 1584 akka.actor.ActorCell
98: 15 720 akka.actor.RepointableActorRef
103: 21 672 akka.actor.ChildActorPath
104: 21 672 akka.actor.Props
Our script turns that into Graphite format and adds some more hierarchy to the package name. In the next section, we will leverage this hierarchy to perform queries on objects counts and sizes.
count.memleak1.akka.actor.ActorCell 18 123
count.memleak1.akka.actor.RepointableActorRef 15 123
count.memleak1.akka.actor.ChildActorPath 21 123
count.memleak1.akka.actor.Props 21 123
In our case, we’ll just forward these logs to the Sumo collector. Previously, we’ve defined a Graphite source for Metrics. Then, it’s as easy as
cat histogram-in-graphite | nc -q0 localhost 2003.
3. Automate processing via Ansible and StackStorm
So far we are now capable of creating a fine-grained measurement of an application’s memory consumption using a couple of shell commands and scripts. Using the DevOps automation tools Ansible and StackStorm, we can turn this manual workflow in an Online Memory Supervision System.
- Ansible helps us to automate taking the measurement of multiple hosts. For each individual host, it connects to the hosts via ssh, runs the
jmapcommand, the python conversion script, and submits the measurement to Sumo. - StackStorm manages this workflow for us. In a given period, it kicks off Ansible and logs the process. In case something goes wrong, it defines remediation steps.
Of course, there are alternatives to the myriad of available tools. Ansible competes with SaltStack, Chef, and Puppet. StackStorm is event-driven automation with all bells and whistles, for this example, we could have used a shell script with sleepor a simple cron job.
Using Sumo to Troubleshoot Memory Leaks
Now it’s time to use Sumo to analyze our memory. In the previous steps, we have submitted and ingested our application’s fine-grained memory consumption data. After this preparation, we can leverage Sumo to query the data and build dashboards.
Using queries, we can perform in-depth analysis. This is useful as part of a post-mortem analysis to track down a memory leak, or during development to check, if a memory allocation/deallocation scheme actually works. During runtime, dashboards could monitor critical components of the application.
Let’s check this out on a live example. We’ll use a setup of three JVMs simulating an application and a StackStorm instance. Each is running in their own Docker container, simulating a distributed system. To make our lives easier, we orchestrate this demo setup using Vagrant:
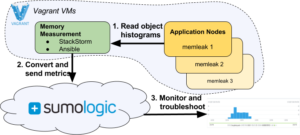
Figure 1: Memory leak demo setup and control flow
A Memory Measurement node orchestrates the acquisition process. We’ve developed a short Ansible script that connects to several application nodes and retrieves a histogram dump from the JVMs running the faulty program from [1]. It converts the dumps to Graphite metrics and sends them via the collector to Sumo. StackStorm periodically triggers the Ansible workflow. Finally, we use the UI to find and debug memory leaks.
Analyze memory consumption
First, we want to get an overview of what’s going on in the memory. We start to look at the total memory consumption of a single host. A simple sum over all objects sizes yields the application’s memory consumption over time. The steeply increasing curve abruptly comes to an end at a total of about 800 Mb. This is the total memory that we dispatched to the JVM (java -Xmx800m -jar memleak-assembly-0.1.jar).
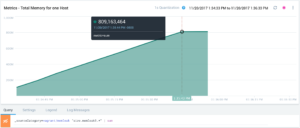
Figure 2: Total memory consumption of host memleak3
Drilling down on top memory consumers often hints at the responsible classes for a memory leak. For that query, we parse out all objects and sum their counts and sizes. Then we display only the top 10 counts. In the size query, we filter out objects above a certain size. These objects are the root objects of the application and do not contain much information.
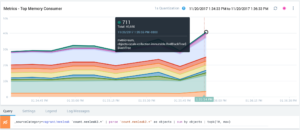
Figure 3: Top memory consumers on a single node
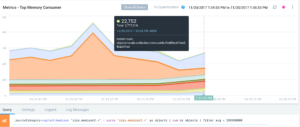
Figure 4: To memory top consumers by size
We find out that a Red-Black Tree dominates the objects. Looking at the Scala manual tells us that HashMaps make extensive use of this data structure:
Scala provides implementations of immutable sets and maps that use a red-black tree internally. Access them under the names TreeSet and TreeMap.
We know that ActorSystem uses HashMaps to store and maintain actors.
Parsing and aggregating queries help to monitor entire subsystems of a distributed application. We use that to find out that the ActorSystem accumulates memory not only on a single host but over a set of hosts. This leads us to believe that this increase might not be an individual error, by a systemic issue.
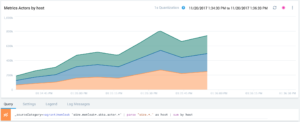
Figure 5: Use query parsing and aggregation operations to display the ActorSystem’s memory consumption
A more detailed view of the Child actor reveals the trend how it accumulates memory. The trick in this query is that in the search part we filter out the packages inakka.actor.* the search expression and then use the aggregation part to parse out the single hosts and sum the size values of their individual objects. Since all three JVMs started at the same time, their memory usage increases at a similar rate in this picture. We can also split this query into three separate queries like below. These are looking at how the Child actors on all three hosts are evolving.
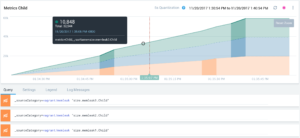
Figure 6: The bad Child actor accumulating memory
Finally, we verify that the patch worked. The latest chart shows that allocation and deallocation are now in balance on all three hosts.
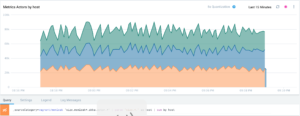
Figure 7: Memory leak removed, all good now
Memory Analysis for Modern Apps
Traditional memory analyzers were born in the era of standalone, desktop applications. Therefore, they work on snapshots and heap dumps and cannot track the dynamicity of memory allocation and deallocation patterns. Moreover, they are also restricted to work on single images and it is not easy to adapt them to a distributed system.
Modern Apps have different requirements. Digital Businesses provide service 24/7, scale out in the cloud, and compete in terms of feature velocity. To achieve feature velocity, detecting memory issues online is more useful than after-the-fact. Bugs such as memory leaks need rapid detection and bugfixes inserted frequently and without stopping services. Pulling heap dumps and starting memory analyzers just won’t work in many cases.
Sumo takes memory analysis to the next level. Leveraging Sumo’s Metrics product we can track memory consumption for classes and objects within an application. We look at aggregations of their counts and sizes to pinpoint the fault. Memory leaks are often hard to find and need superior visibility into an application’s memory stack to become debuggable. Sumo achieves this not only for a single instance of an application but scales memory analysis across the cloud. Additionally, Sumo’s Unified Logs and Monitoring (ULM) enables correlating logs and metrics and facilitates understanding the root cause of a memory leak.
Bottom Line
In this post, we showed how to turn Sumo into a fine-grained, online memory supervision system using modern DevOps tools. The fun doesn’t stop here. The presented framework can be easily extended to include metrics for threads and other resources of an application. As a result of this integration, developers and operators gain high visibility in the execution of their application.
