MySQL has always been among one of the top few database management systems used worldwide, according to DB-engines, one of the leading ranking websites. And thanks to the large open source community behind MySQL, it also solves a wide variety of use cases.
In this blog post, we are going to focus on how to achieve transactional behavior with MySQL and Slick. We will also discuss how these transactions resulted in one of our production outages.

But before going any further into the details, let’s first define what a database transaction is. In the context of relational databases, a sequence of operations that satisfies some common properties is known as a transaction. This common set of properties, which determine the behavior of these transactions are referred to as atomic, consistent, isolated and durable (ACID) properties. These properties are intended to guarantee the validity of the underlying data in case of power failure, errors, or other real-world problems. The ACID model talks about the basic supporting principles one should think about before designing database transactions. All of these principles are important for any mission-critical applications.

One of the most popular storage engines we use in MySQL is InnoDB, whereas Slick is the modern database query and access library for Scala. Slick exposes the underlying data stored in these databases as Scala collections so that data stored onto these databases is seamlessly available. Database transactions come with their own set of overhead, especially in cases when we have long running queries wrapped in a transaction.
Let’s understand the transaction behavior, which we get with Slick. Slick offers ways to execute transactions on MySQL.
function fetchCustomers(): Observable<Customer[]> { ... }
val a = (for {
ns <- coffees.filter(_.name.startsWith("ESPRESSO")).map(_.name).result
_ <- DBIO.seq(ns.map(n => coffees.filter(_.name === n).delete): _*)
} yield ()).transactionally
These transactions are executed with the help of the Auto-Commit feature provided by the InnoDB engine. We will go into this auto-commit feature later in this article, but first, let me tell you about an outage, which happened on our production services at Sumo Logic and resulted in one of the outages.
For the rest of the article, I will be talking about one of our minor outages which happened due to this lack of understanding in this transaction behavior.
Whenever any user fires a query, the query follows this course of action before getting started:
- Query metadata i.e. user, customerID is first sent to Service A
- Service A asks this common Amazon MySQL RDS for the number of concurrent sessions for this user running across all the instances for this Service A
- If the number is greater than some threshold we throttle the request and send 429 to the user.
- Otherwise, we just add the metadata of the session to the table stored in RDS
All of these actions are executed within the scope of a single slick transaction.
Recently we started receiving lots of lock wait timeouts on this Service A. On debugging further, we saw that from the time we started getting lots of lock wait timeouts, there was also an increase in the average CPU usage across the Service A cluster. Looking into some of these particular issues of lock wait timeouts, we noticed that whenever we had an instance in the cluster going through full GC cycles, that resulted in a higher number of lock wait timeouts across the cluster. But interestingly enough, these lock wait timeouts were all across the cluster and not isolated on the single instance, which suffered from full GC cycles.
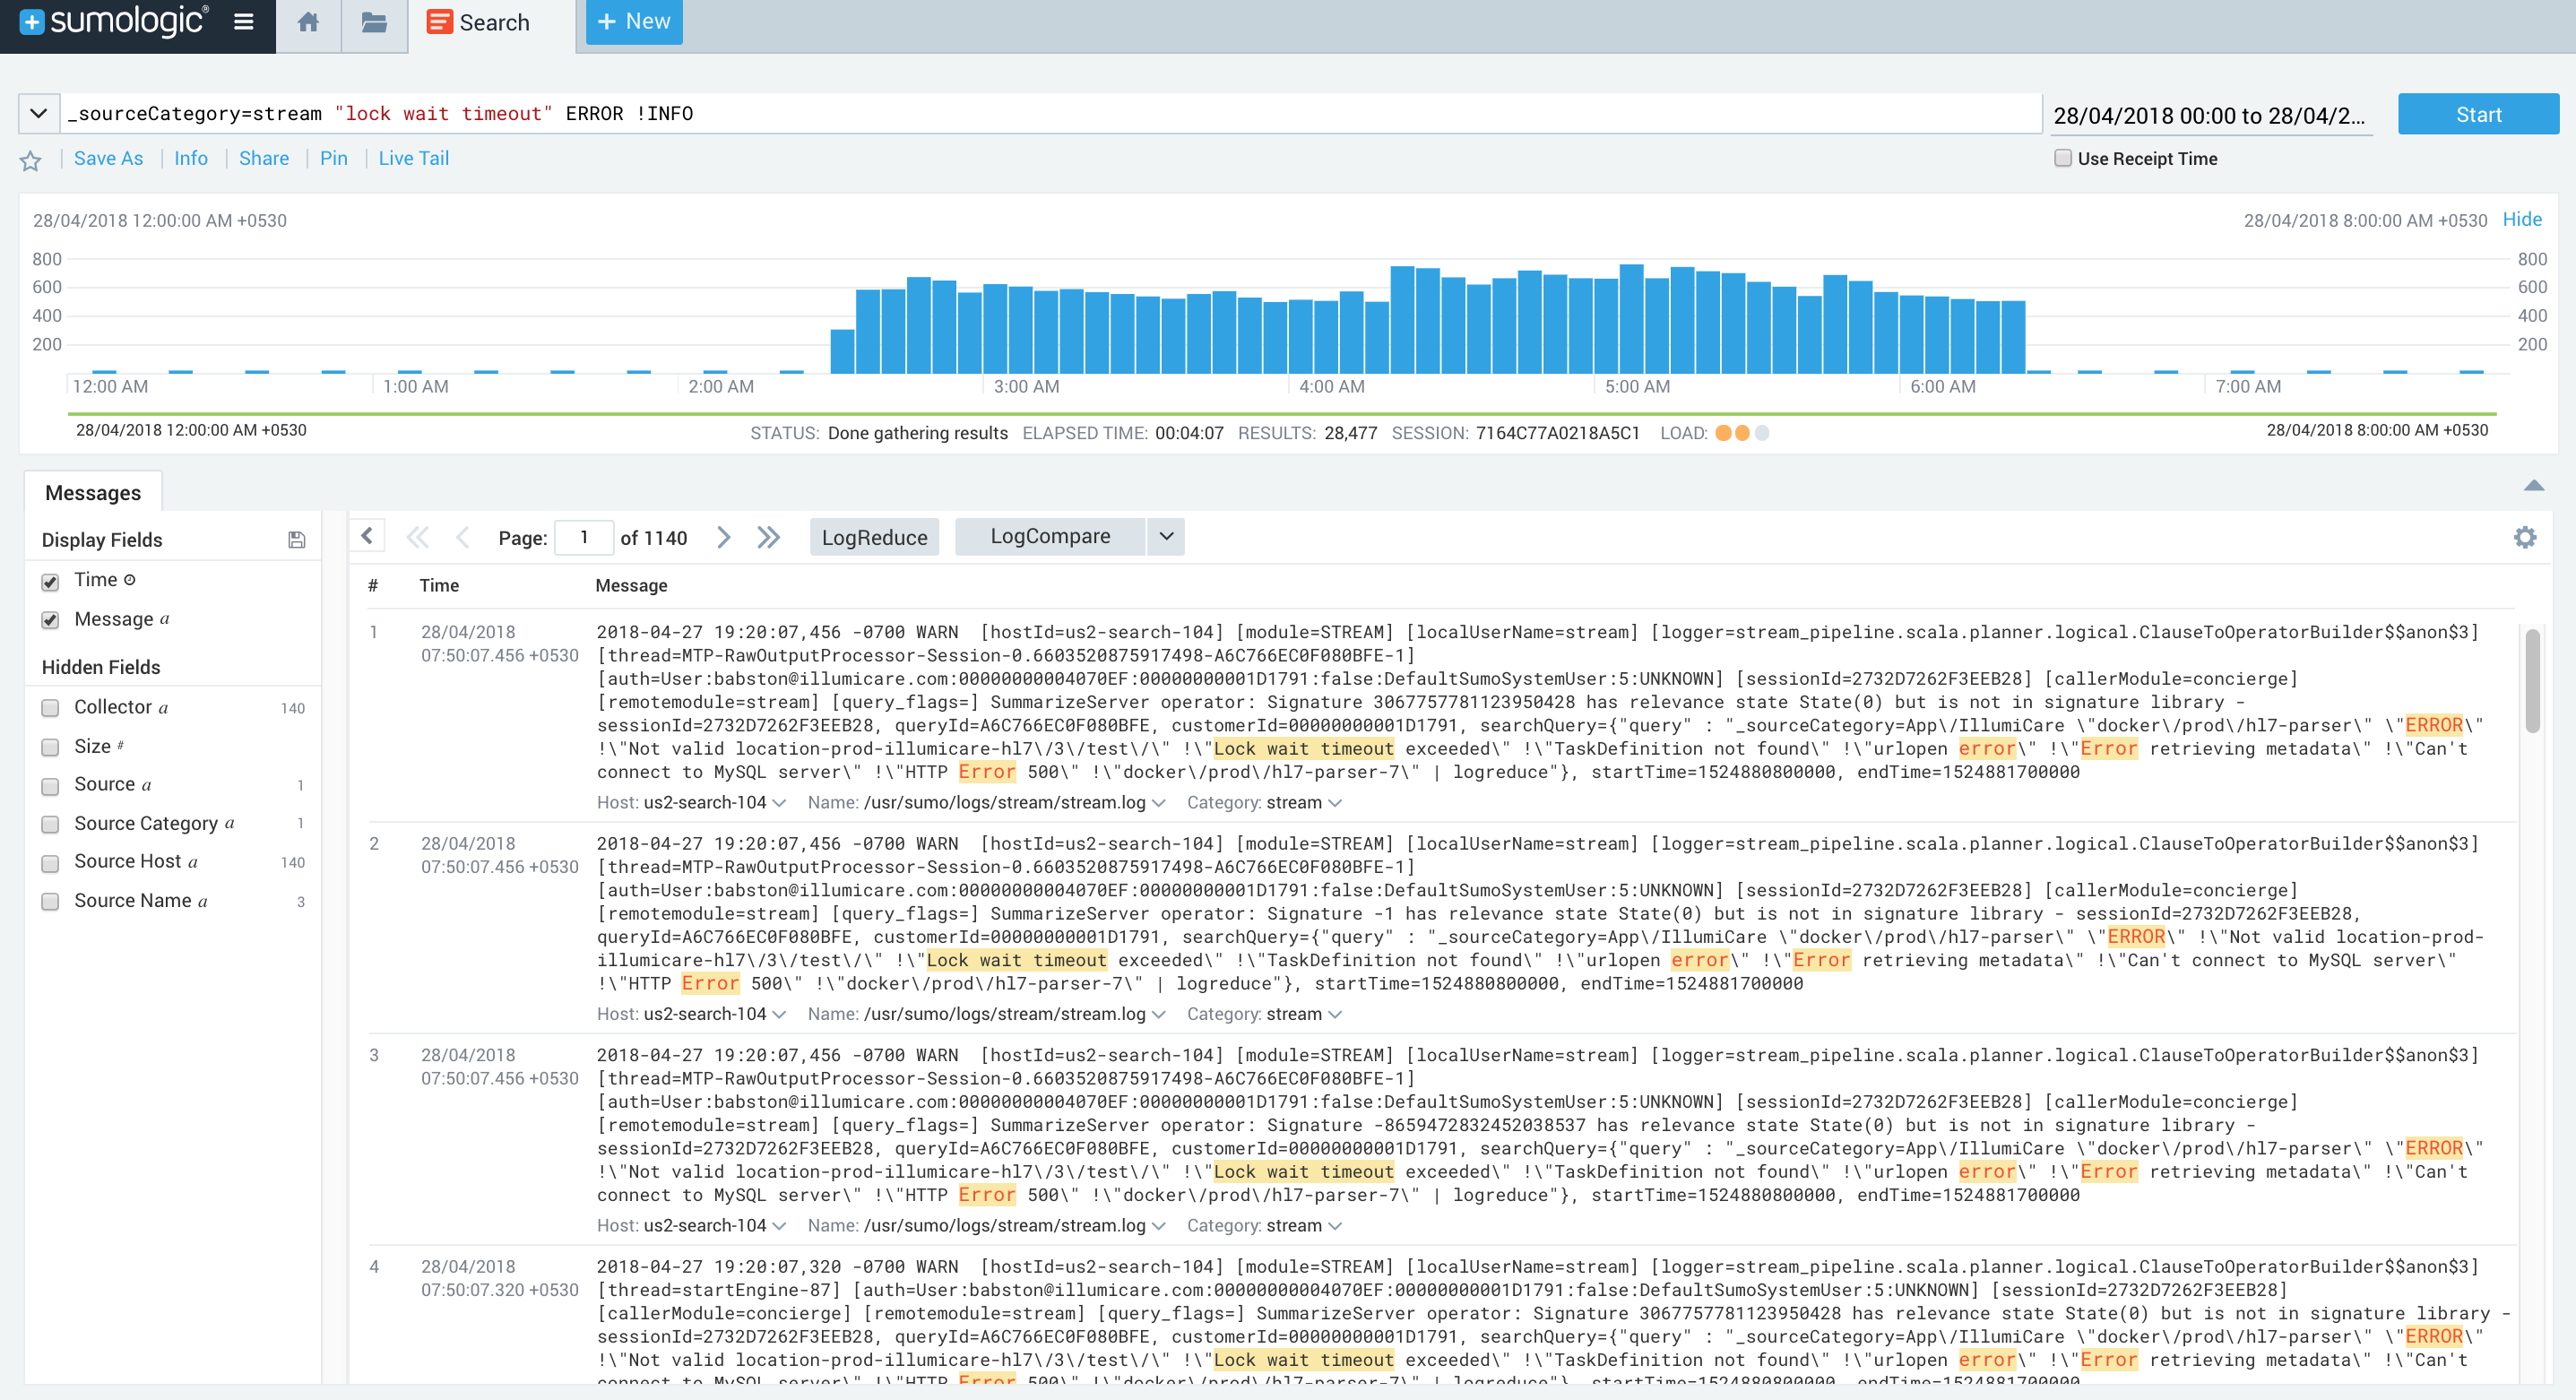
Based on that, we knew that full GC cycles on one of the nodes were somewhat responsible for causing those lock wait timeouts across the cluster.
As already mentioned above, we used the transaction feature provided by slick to execute all of the actions as a single command. So the next logical step was to dig deeper into understanding the question: “how does Slick implement these transactions”?
We found out that Slick uses the InnoDB feature of auto-commits to execute transactions. In the auto-commit disabled mode, the transaction is kept open until the transaction is committed from the client side, which essentially means that the connection executing the current transaction holds all the locks until the transaction is committed.
Auto-Commit Documentation from the InnoDB Manual
In InnoDB, all user activity occurs inside a transaction. If auto-commit mode is enabled, each SQL statement forms a single transaction on its own. By default, MySQL starts the session for each new connection with auto-commit enabled, so MySQL does a commit after each SQL statement if that statement did not return an error. If a statement returns an error, the commit or rollback behavior depends on the error. See Section 14.21.4, “InnoDB Error Handling”.
A session that has auto-commit enabled can perform a multiple-statement transaction by starting it with an explicit START TRANSACTION or BEGIN statement and ending it with a COMMIT or ROLLBACK statement. See Section 13.3.1, “START TRANSACTION, COMMIT, and ROLLBACK Syntax”.
If auto-commit mode is disabled within a session with SET auto-commit = 0, the session always has a transaction open. A COMMIT or ROLLBACK statement ends the current transaction and a new one starts.
Pay attention to the last sentence above. This means if auto-commit is disabled, then the transaction is open, which means all the locks are still with this transaction.
All the locks, in this case, will be released only when we explicitly COMMIT the transaction. So in our case, our inability to execute the remaining commands within the transaction due to a high GC, meant that we were still holding onto the locks on the table and therefore would mean that other JVMs executing the transaction touching the same table (which is, in fact, the case), would also suffer from high latencies.
But we needed to be sure that was the case on our production environments. So we went ahead with reproducing the production issue on the local testbed, making sure that locks were still held by the transaction on the node undergoing high GC cycles.
Steps to Reproduce the High DB Latencies on One JVM Due to GC Pauses on Another JVM
Step One
We needed some way to know when the queries in the transactions were actually getting executed by the MySQL server.
mysql> SET global general_log = 1;mysql> SET global log_output = 'table';mysql> SELECT * from mysql.general_log;
So MySQL general logs show the recent queries which were executed by the server.
Step Two
We needed two different transactions to execute at the same time in different JVMs to understand this lock wait timeout.
Transaction One:
val query = (for {ns <- userSessions.filter(_.email.startsWith(name)).length.result_ <- {println(ns)if (ns > n) DBIOAction.seq(userSessions += userSession)else DBIOAction.successful(())}} yield ()).transactionallydb.run(query)
Transaction Two:
db.run(userSessions.filter(_.id === id).delete)Step Three
Now we needed to simulate the long GC pauses or pauses in one of the JVMs to mimic the production environments. On mimicking those long pauses, we need to monitor the mysql.general logs for finding out when did the command reached the MySQL server for asking to be executed.
The below chart depicts the order of SQL statements getting executed on both JVMs:
| JVM 1( Adding the session of the user ) | JVM 2 ( Delete the session of the user if present ) |
| SET auto-commit = 0 ( as in false ) | |
| SELECT count(*) FROM USERS where User_id = “temp” ( LOCKS ACQUIRED ) | SET auto-commit = 0 |
| INSERT INTO USERS user_session | DELETE FROM USERS where sessionID = “121” ( Started ) |
| INTRODUCED HIGH LATENCY ON THE CLIENT SIDE FOR 40 SECONDS | DELETE OPERATION IS BLOCKED DUE TO THE WAITING ON THE LOCK |
| COMMIT | DELETE FROM USERS where sessionID = “121” ( Completed ) |
| COMMIT |
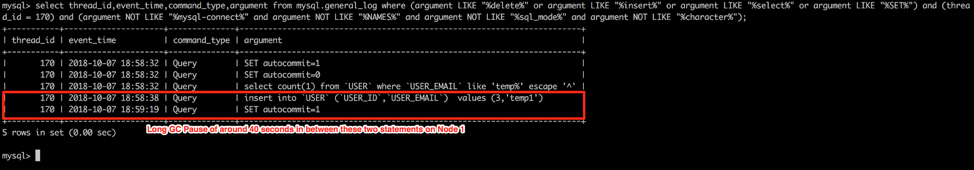
In the below image, you can see the SQL statements getting executed on both the JVMs:
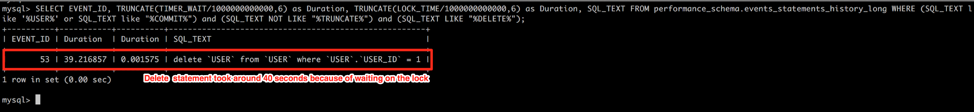
This image shows the lock wait time of around 40 seconds on JVM 2 on “Delete SQL” command:
We can clearly see from the logs how pauses in one JVM causes high latencies across the different JVMs querying on MySQL servers.
Handling Such Scenarios with MySQL
We more than often need to handle this kind of scenario where we need to execute MySQL transactions across the JVMs. So how can we achieve low MySQL latencies for transactions even in cases of pauses in one of the JVMs? Here are some solutions:
-
- Using Stored Procedures
- With stored procedures, we could easily extract out this throttling logic into a function call and store it as a function on MySQL server.
- They can be easily called out by clients with appropriate arguments and they can be executed all at once on the server side without being afraid of the client side pauses.
- Along with the use of transactions in the procedures, we can ensure that they are executed atomically and results are hence consistent for the entire duration of the transaction.
- Delimit Multiple Queries
- With this, we can create transactions on the client side and execute them atomically on the server side without being afraid of the pauses.
- Note: You will need to enable allowMultiQueries=true because this flag allows batching multiple queries together into a single query and hence you will be able to run transactions as a single query.
- Better Indexes on the Table
- With better indices, we can ensure that while executing SELECT statements with WHERE condition we touch minimal rows and hence ensuring minimal row locks.
- Let’s suppose we don’t have any index on the table, then in that case for any select statement, we need to take a shared row lock on all the rows of the table, which will mean that during the execution phase of this transaction all the delete or updates would be blocked. So it’s generally advised to have WHERE condition in SELECT to be on an index.
- Lower Isolation Levels for executing Transactions
- With READ UNCOMMITTED isolation levels, we can always read the rows which still have not been committed.
- Using Stored Procedures
Additional Resources
- Want more articles like this? Check out the Sumo Logic blog for more technical content!
- Read this blog to learn how to triage test failures in a continuous delivery lifecycle
- Check out this article for some clear-cut strategies on how to manage long-running API queries using RxJS
- Visit the Sumo Logic App for MySQL page to learn about cloud-native monitoring for MySQL
